- 1. Why does some data update fast and some data update slowly?
- 2. Which data is updated quickly and which data is updated slowly?
- 2.1 Residential, Grid-Tied/Centralized
- 2.2 Residential, Self-consumption
- 2.3 Residential, Energy Storage
- 2.4 Commercial/Industrial/Ground Mounted, Grid-Tied/Centralized
- 2.5 Commercial/Industrial/Ground Mounted, Self-consumption
- 2.6 Commercial/Industrial/Ground Mounted, Energy Storage
- 2.7 All plant type and system type, Lite Mode
1. Why does some data update fast and some data update slowly?
Now there is a problem. After the plant is created, the installer needs to wait for the plant and inverter to be online on the SOLARMAN Business platform, which takes a long time. To solve this problem, we introduce streaming processing. so the waiting time after the completion of the plant creation will be shortened to 0~6 minutes (average 3 minutes, max 6 minutes), compared to the past (all data are periodic batch processing, average 6 minutes, max 12 minutes) reduced by 50%+.
However, the SOLARMAN platform has been connected to nearly 10 million devices and 1.5 million plants. It is impossible for all data to be streamed. Therefore, this is the reason why does some data update fast and some data update slowly.
So it is normal that the daily generation in real-time is different from the history-month.
Finally, we recommend a residential plant with only 1 inverter. You can leave the plant site when you see that the communication status of the plant is normal.
2. Which data is updated quickly and which data is updated slowly?
2.1 Residential, Grid-Tied/Centralized
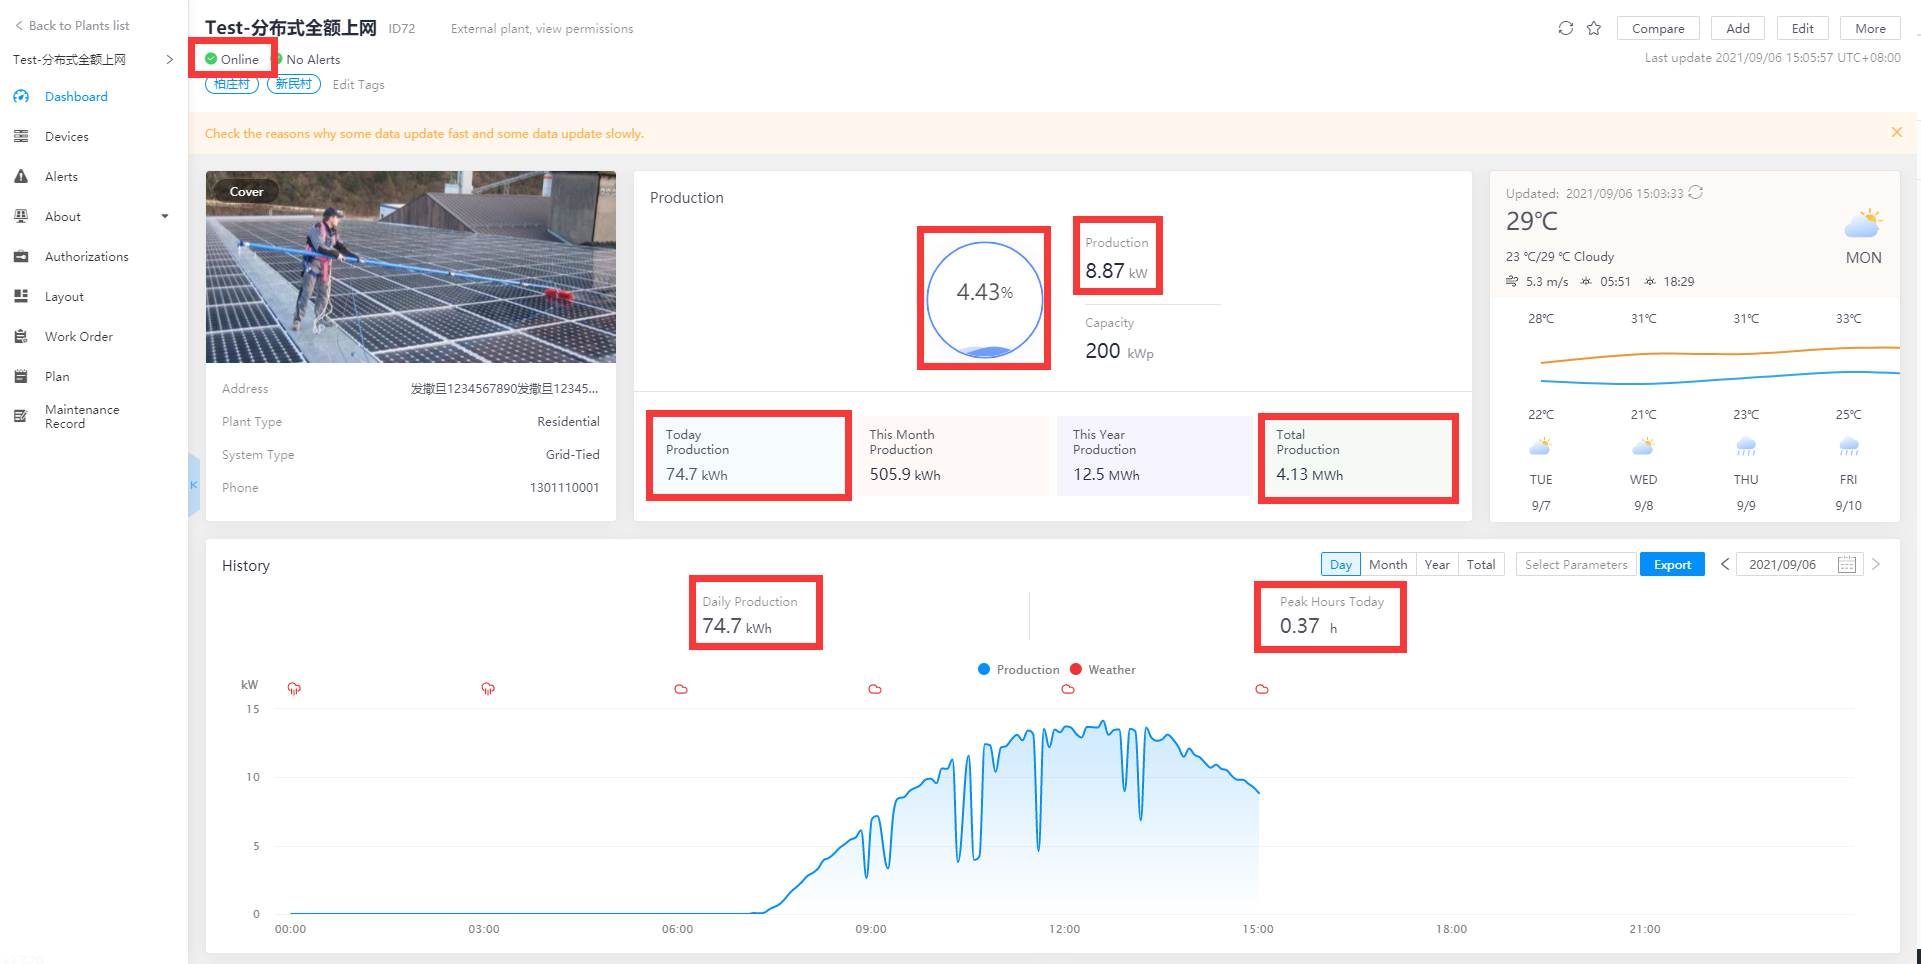
The red box part is fast data, and the others are slow data: including plant communication status; power normalized, power production, today production, total production (if the cumulative total production uses the sum of daily production, then also slow data) in real-time; daily production, peak hours today in history.
2.2 Residential, Self-consumption
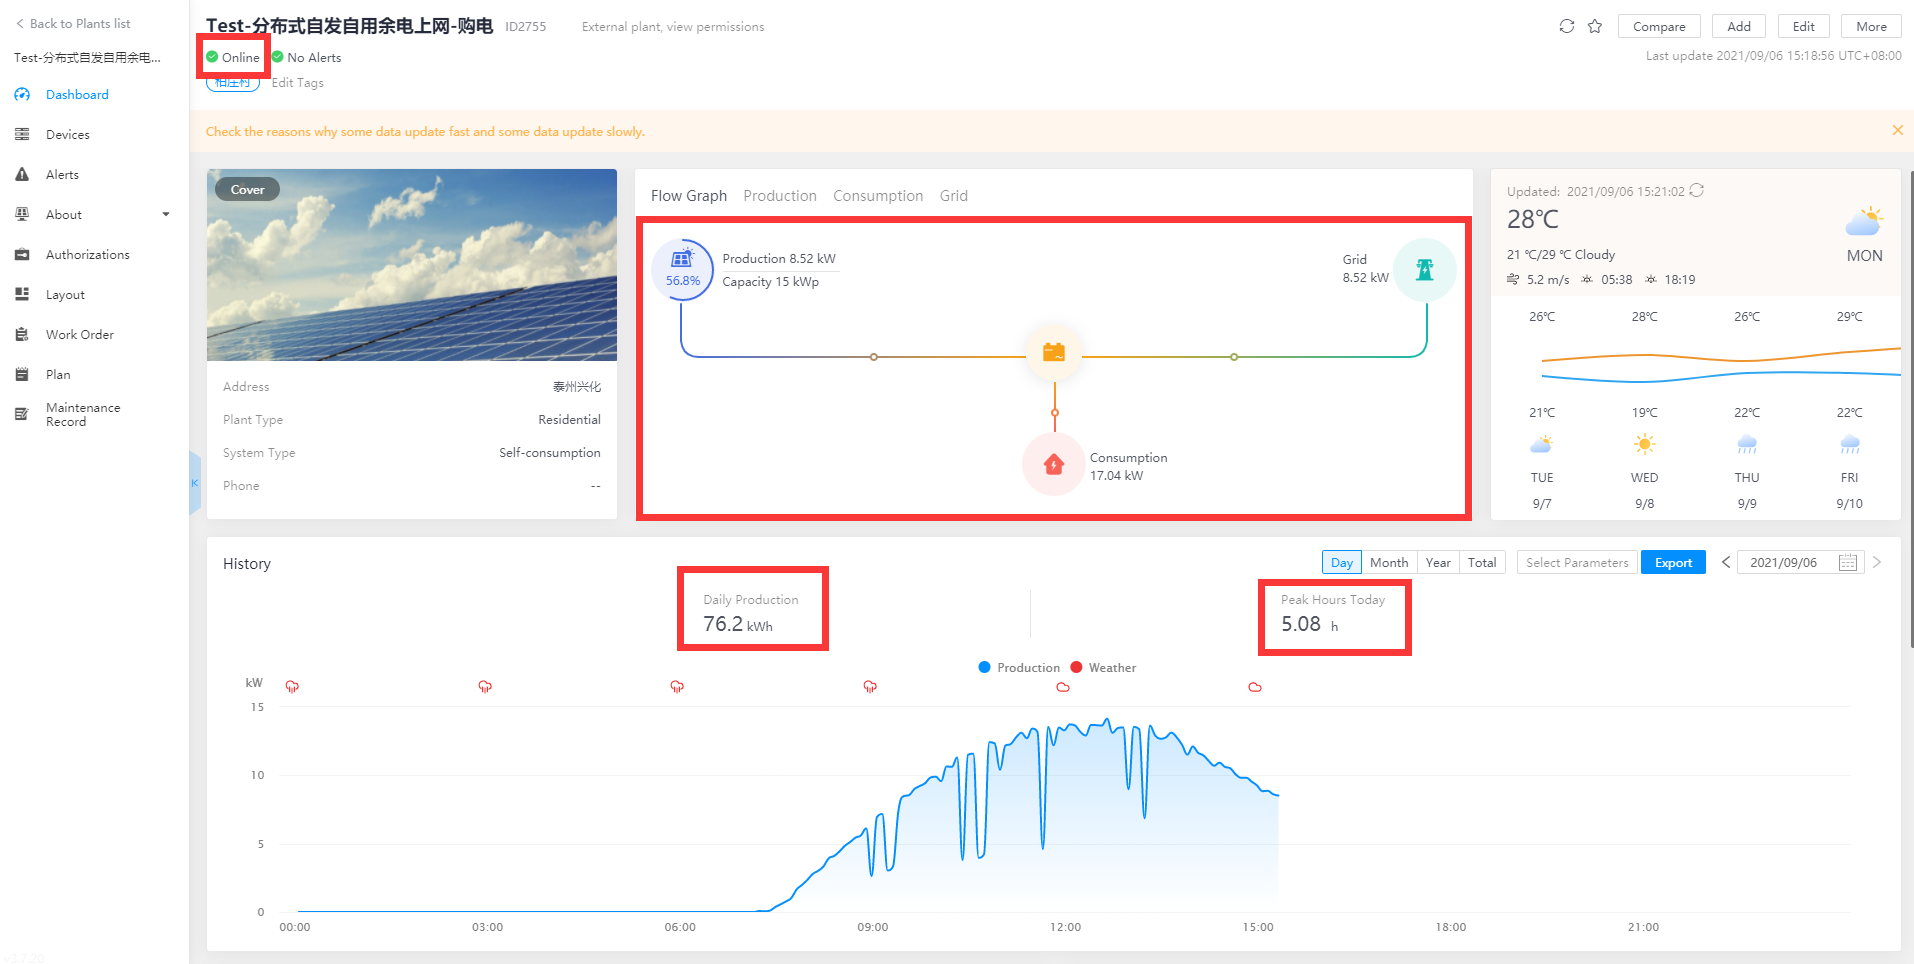
The red box part is fast data, and the others are slow data: including plant communication status; all datas in flow graph; daily production, peak hours today in history.
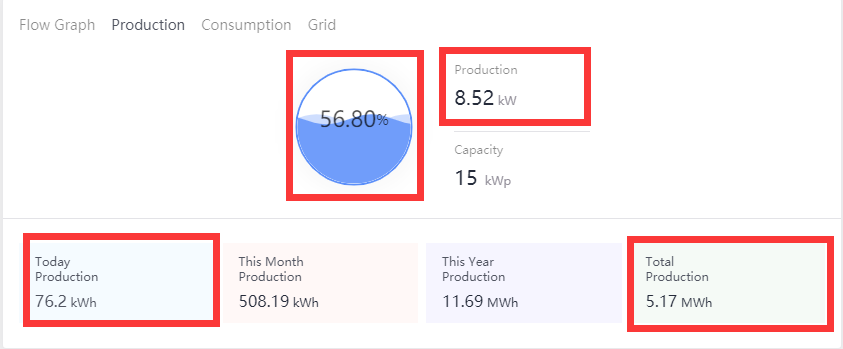
The red box part is fast data, and the others are slow data: including power normalized, power production, today production, total production (if the cumulative total production uses the sum of daily production, then also slow data) in real-time

The red box part is fast data, and the others are slow data: including consumption power, daily consumption, total consumption (if the cumulative total consumption uses the sum of daily consumption, then also slow data) in real-time
The red box part is fast data, and the others are slow data: including grid power, daily grid feed-in, total grid feed-in (if the cumulative total grid feed-in uses the sum of daily grid feed-in, then also slow data) , daily energy purchased, total energy purchased (if the cumulative total energy purchased uses the sum of daily grid energy purchased, then also slow data) in real-time
2.3 Residential, Energy Storage
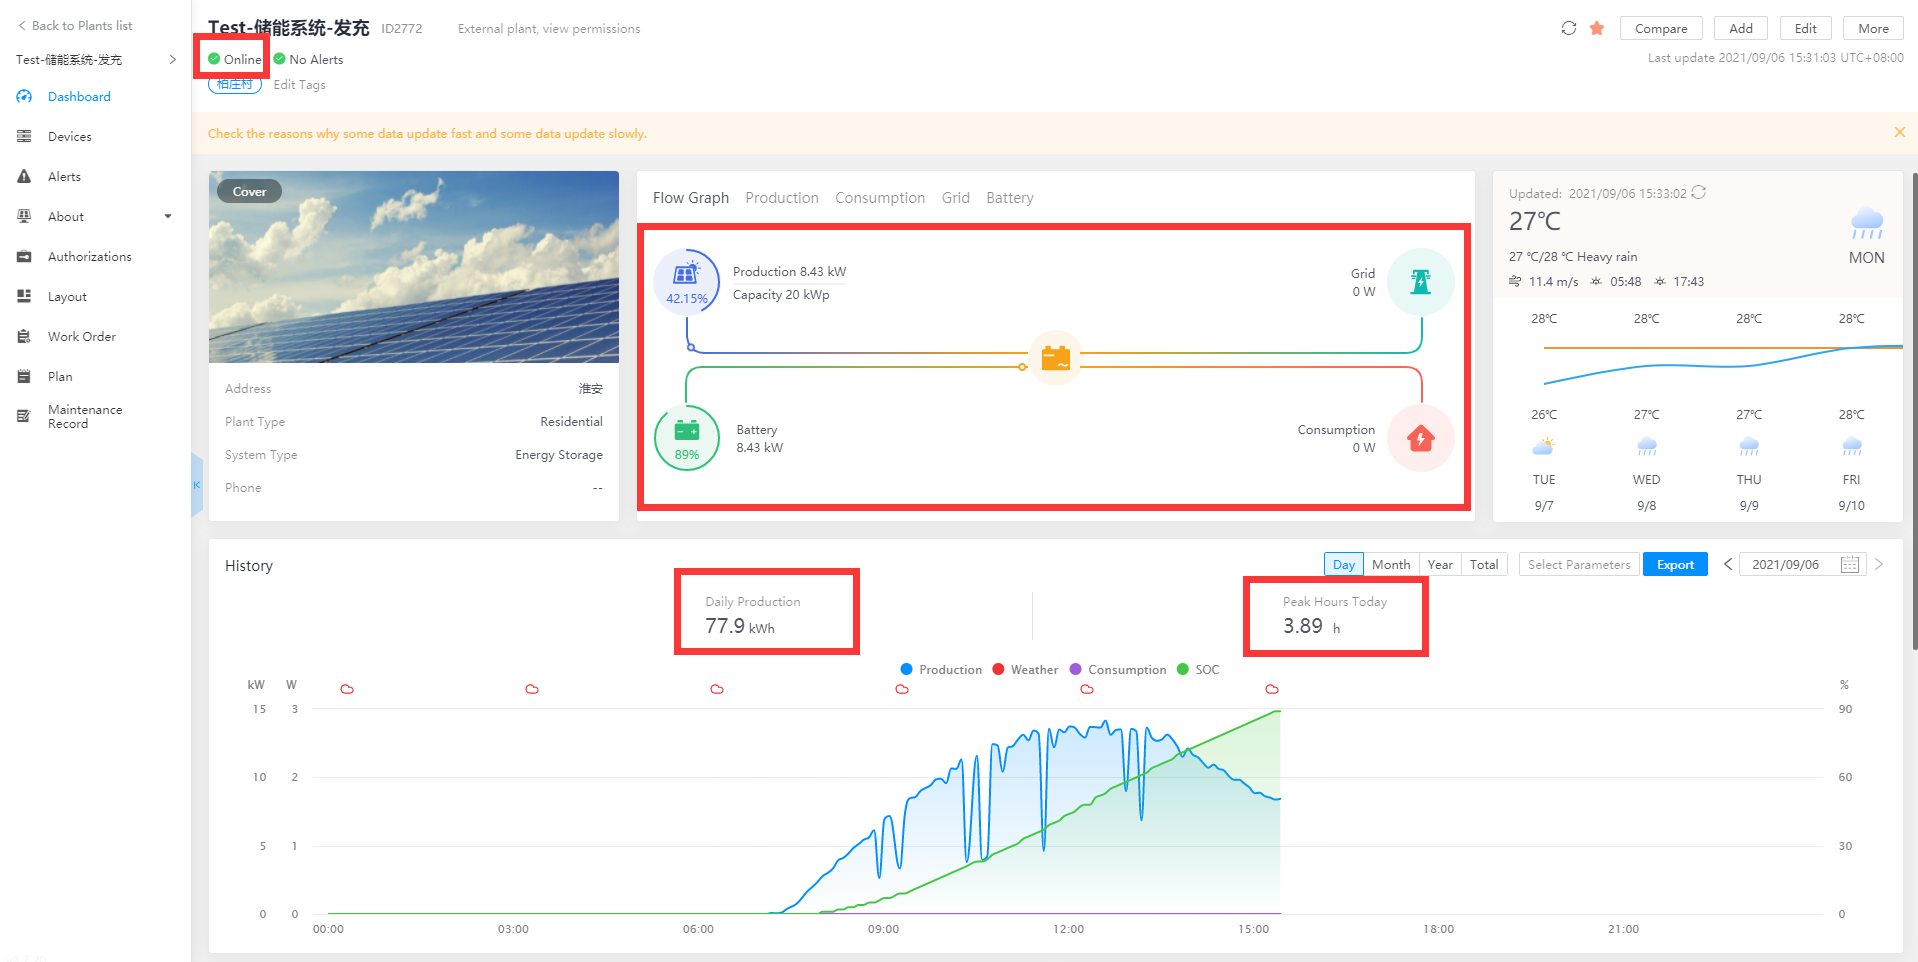
The red box part is fast data, and the others are slow data: including plant communication status; all datas in flow graph; daily production, peak hours today in history.

The red box part is fast data, and the others are slow data: including power normalized, power production, today production, total production (if the cumulative total production uses the sum of daily production, then also slow data) in real-time
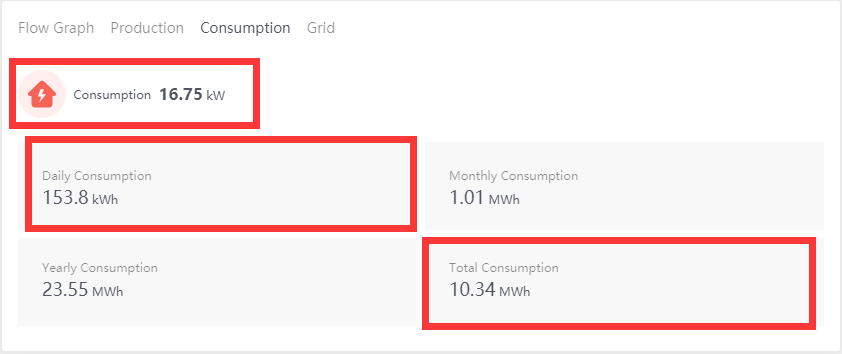
The red box part is fast data, and the others are slow data: including consumption power, daily consumption, total consumption (if the cumulative total consumption uses the sum of daily consumption, then also slow data) in real-time
The red box part is fast data, and the others are slow data: including grid power, grid status, daily grid feed-in, total grid feed-in (if the cumulative total grid feed-in uses the sum of daily grid feed-in, then also slow data) , daily energy purchased, total energy purchased (if the cumulative total energy purchased uses the sum of daily grid energy purchased, then also slow data) in real-time
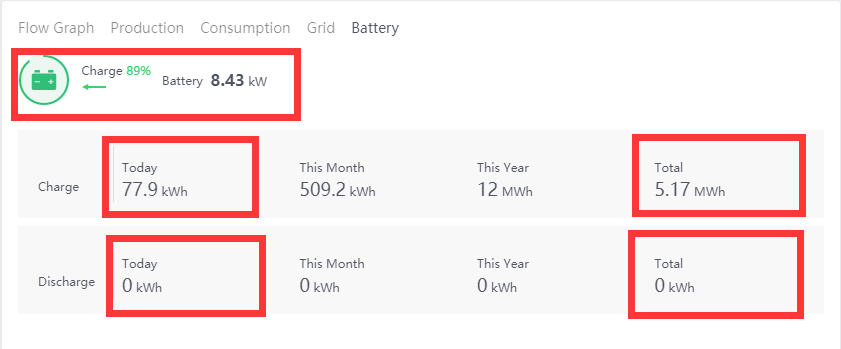
The red box part is fast data, and the others are slow data: including battery power, battery status, daily charge, total charge (if the cumulative total charge uses the sum of daily charge, then also slow data) , daily discharge, total discharge (if the cumulative total discharge uses the sum of daily charge, then also slow data) in real-time
2.4 Commercial/Industrial/Ground Mounted, Grid-Tied/Centralized
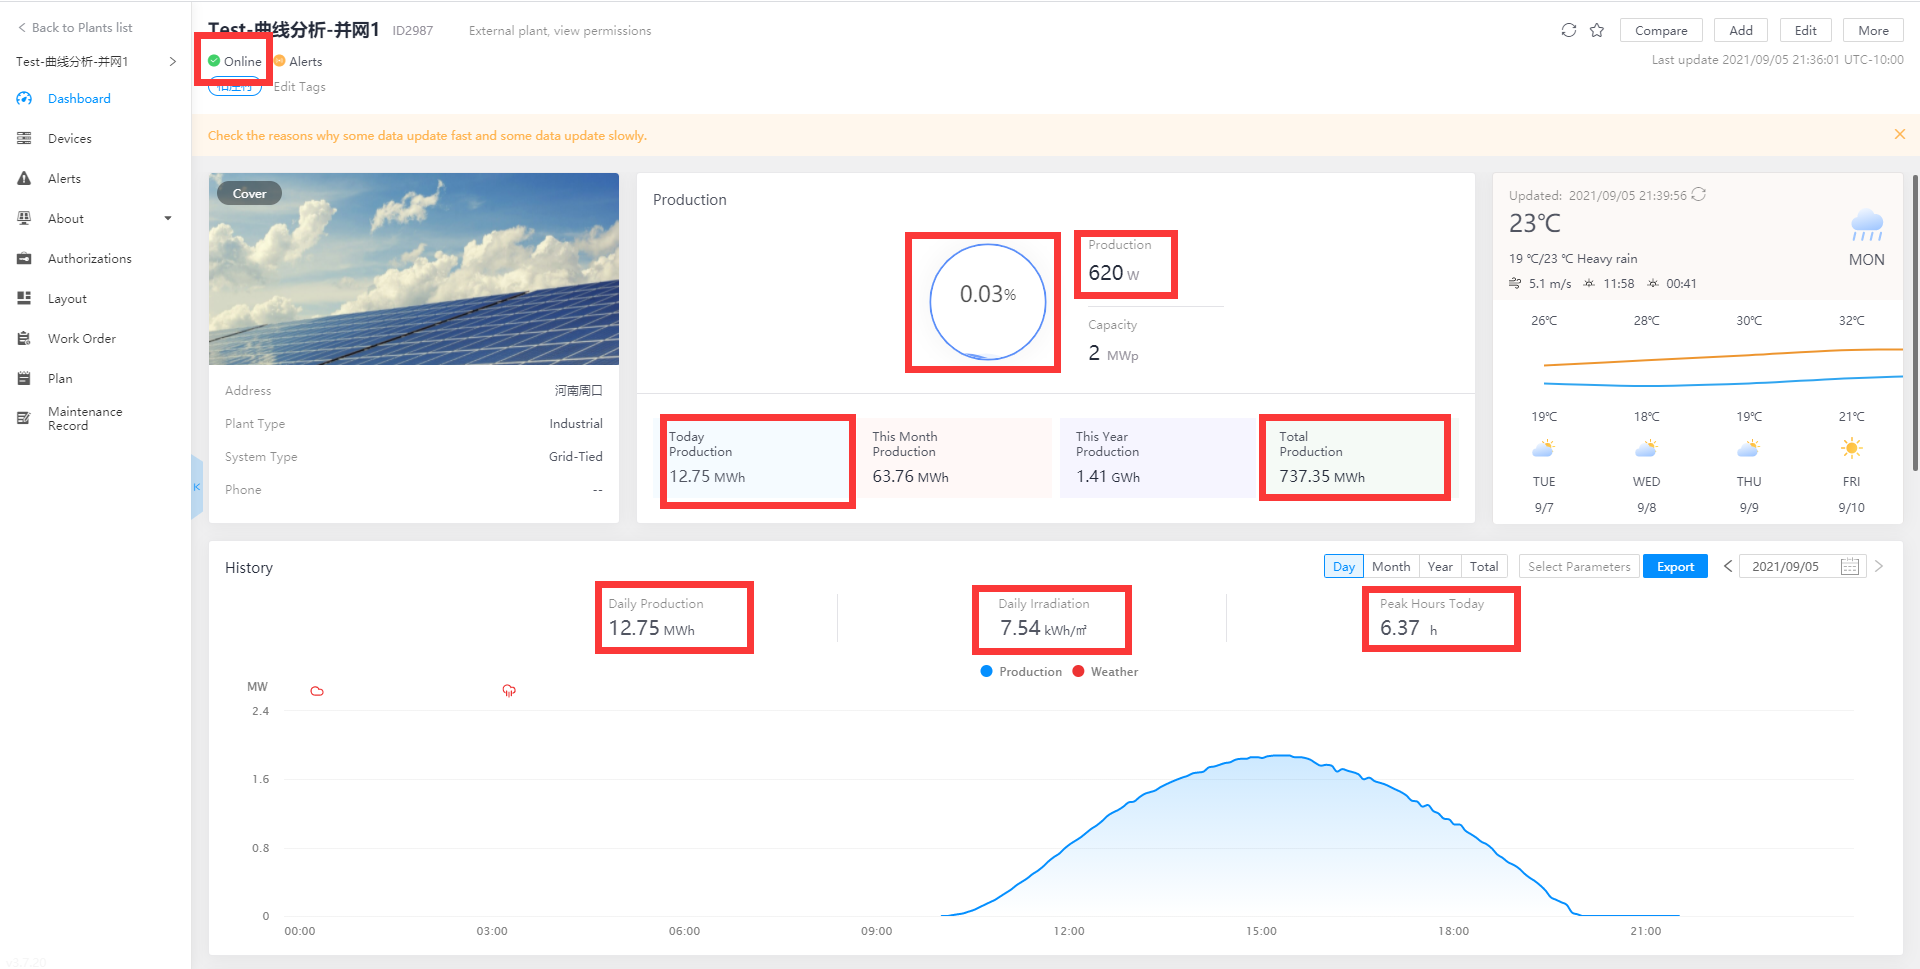
The red box part is fast data, and the others are slow data: including plant communication status; power normalized, power production, today production, total production (if the cumulative total production uses the sum of daily production, then also slow data) in real-time; daily production, peak hours today, daily irradiation in history.
2.5 Commercial/Industrial/Ground Mounted, Self-consumption
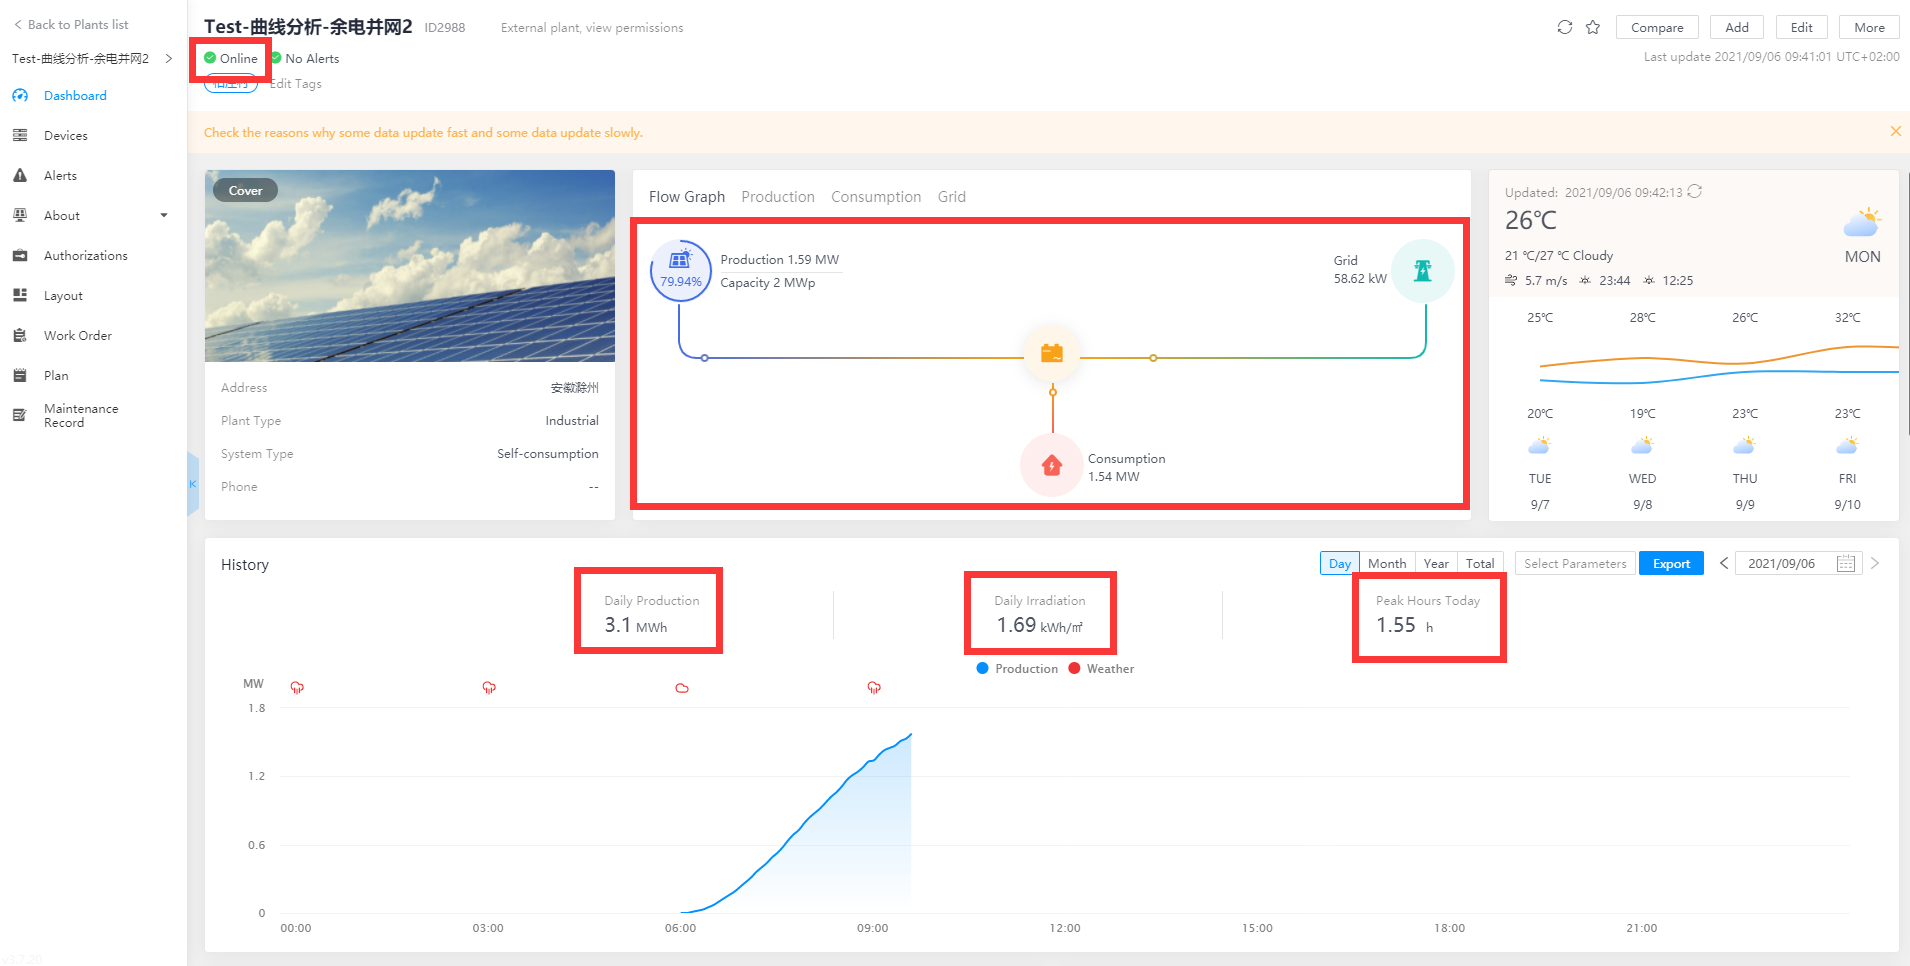
The red box part is fast data, and the others are slow data: including plant communication status; all datas in flow graph; daily production, peak hours today, daily irradiation in history.
The red box part is fast data, and the others are slow data: including power normalized, power production, today production, total production (if the cumulative total production uses the sum of daily production, then also slow data) in real-time

The red box part is fast data, and the others are slow data: including consumption power, daily consumption, total consumption (if the cumulative total consumption uses the sum of daily consumption, then also slow data) in real-time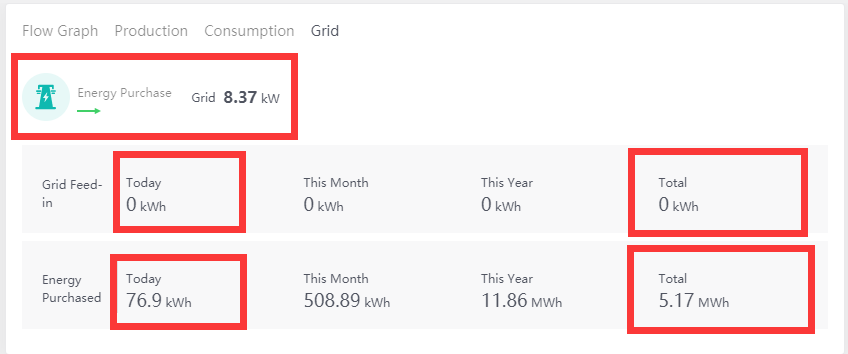
The red box part is fast data, and the others are slow data: including grid power, daily grid feed-in, total grid feed-in (if the cumulative total grid feed-in uses the sum of daily grid feed-in, then also slow data) , daily energy purchased, total energy purchased (if the cumulative total energy purchased uses the sum of daily grid energy purchased, then also slow data) in real-time
2.6 Commercial/Industrial/Ground Mounted, Energy Storage
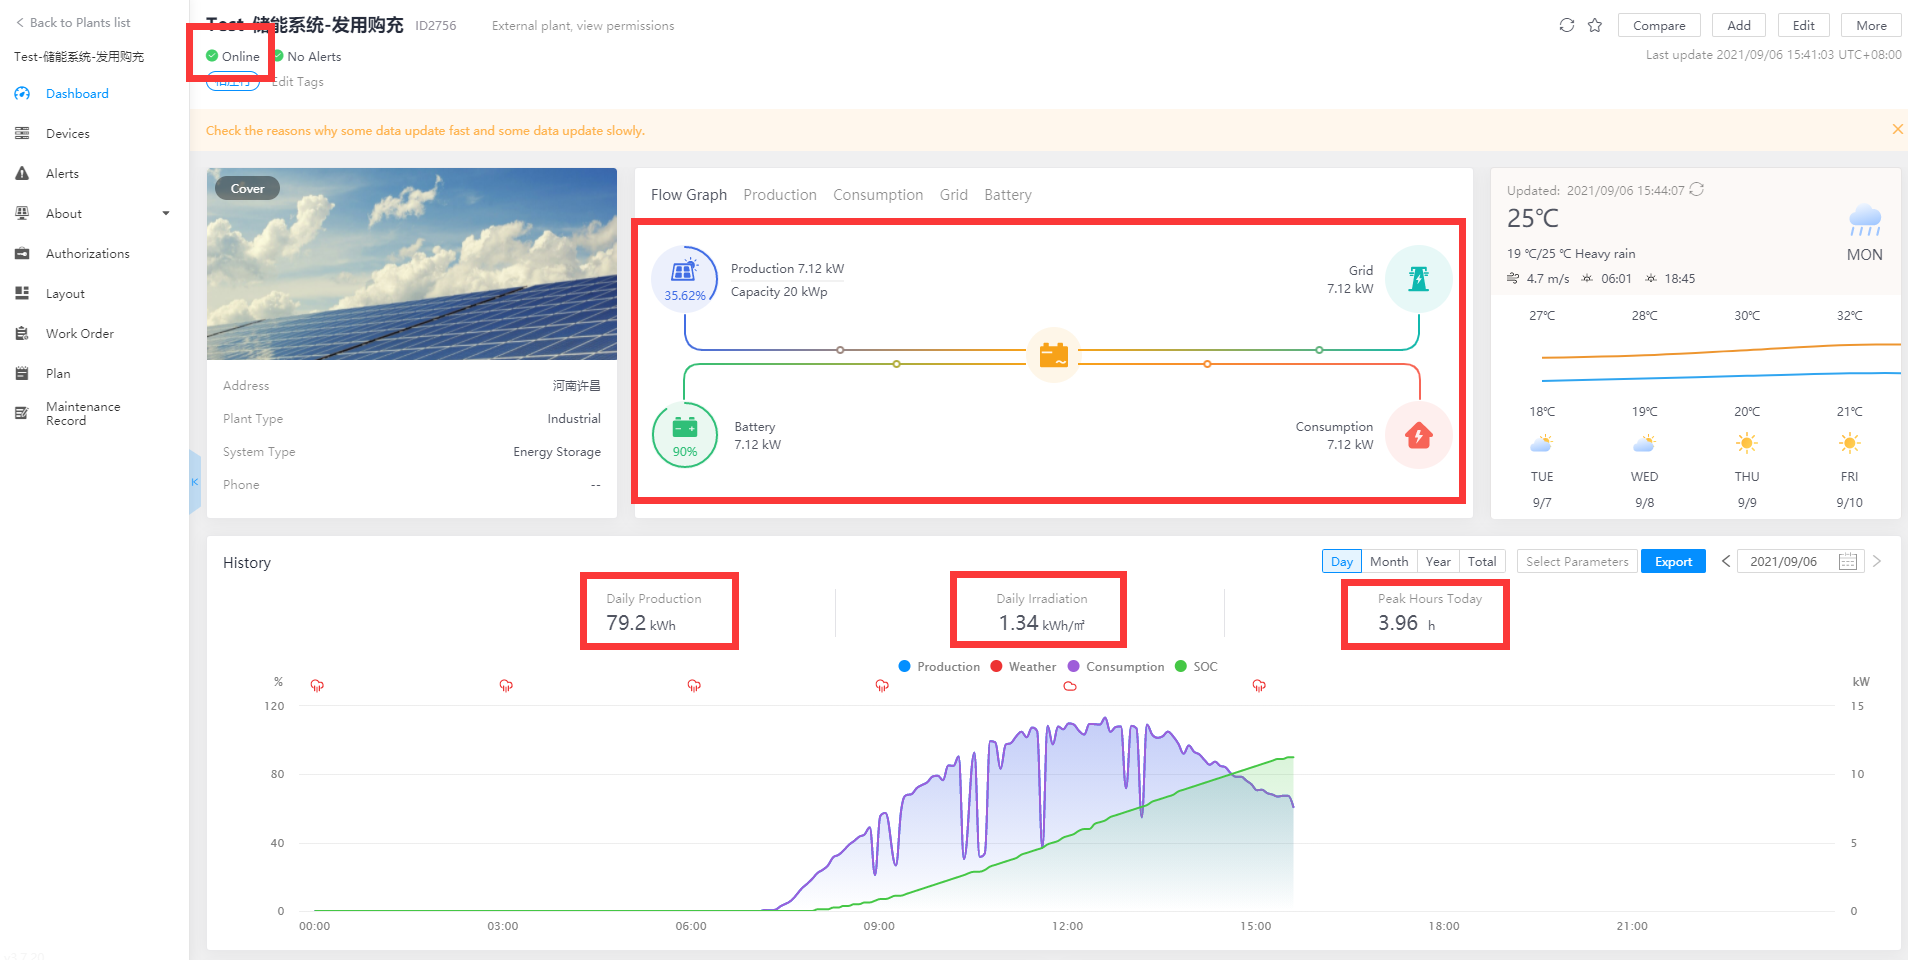
The red box part is fast data, and the others are slow data: including plant communication status; all datas in flow graph; daily production, peak hours today, daily irradiation in history.

The red box part is fast data, and the others are slow data: including power normalized, power production, today production, total production (if the cumulative total production uses the sum of daily production, then also slow data) in real-time

The red box part is fast data, and the others are slow data: including consumption power, daily consumption, total consumption (if the cumulative total consumption uses the sum of daily consumption, then also slow data) in real-time
The red box part is fast data, and the others are slow data: including grid power, grid status, daily grid feed-in, total grid feed-in (if the cumulative total grid feed-in uses the sum of daily grid feed-in, then also slow data) , daily energy purchased, total energy purchased (if the cumulative total energy purchased uses the sum of daily grid energy purchased, then also slow data) in real-time

The red box part is fast data, and the others are slow data: including battery power, battery status, daily charge, total charge (if the cumulative total charge uses the sum of daily charge, then also slow data) , daily discharge, total discharge (if the cumulative total discharge uses the sum of daily charge, then also slow data) in real-time
2.7 All plant type and system type, Lite Mode

In the lite mode, the type, status, and data of the device are all processed in stream, and the update cycle is 0~6 minutes
To learn more about the features of SOLARMAN Business Web, please click

若有收获,就点个赞吧
0 人点赞
