在本教程中,我们将介绍如何使用VChart绘制一个简单的条形图。VChart是一个简单易用、跨平台、高性能的前端可视化图表库。图表由数据、系列和组件组成。我们将使用配置选项来声明图表。
获取 VChart
你可以通过以下方式获取VChart。
使用 NPM 包
首先,你需要在项目根目录中使用以下命令安装 VChart:
# Install using npmnpm install @visactor/vchart# Install using yarnyarn add @visactor/vchart
使用 CDN
你也可以通过 CDN 获取预构建的 VChart 文件。在 HTML 文件中的标签中添加以下代码:
<script src="https://unpkg.com/@visactor/vchart/build/index.min.js"></script>
导入 VChart
通过 NPM 包导入
在 JavaScript 文件顶部使用 import 语句导入 VChart:
import VChart from '@visactor/vchart';
通过 script 标签导入
在 HTML 文件中直接添加一个 标签来导入预构建的 vchart 文件:
<!DOCTYPE html><html><head><meta charset="utf-8" /><!-- Import vchart file --><script src="https://unpkg.com/@visactor/vchart/build/index.min.js"></script></head></html>
绘制一个简单的图行
在绘制之前,我们需要为 VChart 准备一个具有宽度和高度的 DOM 容器。
<body><!-- Prepare a DOM with size (width and height) for vchart, or you can specify it in the spec configuration --><div id="chart" style="width: 600px;height:400px;"></div></body><body><!-- Prepare a DOM with size (width and height) for vchart, or you can specify it in the spec configuration --><div id="chart" style="width: 600px;height:400px;"></div></body>
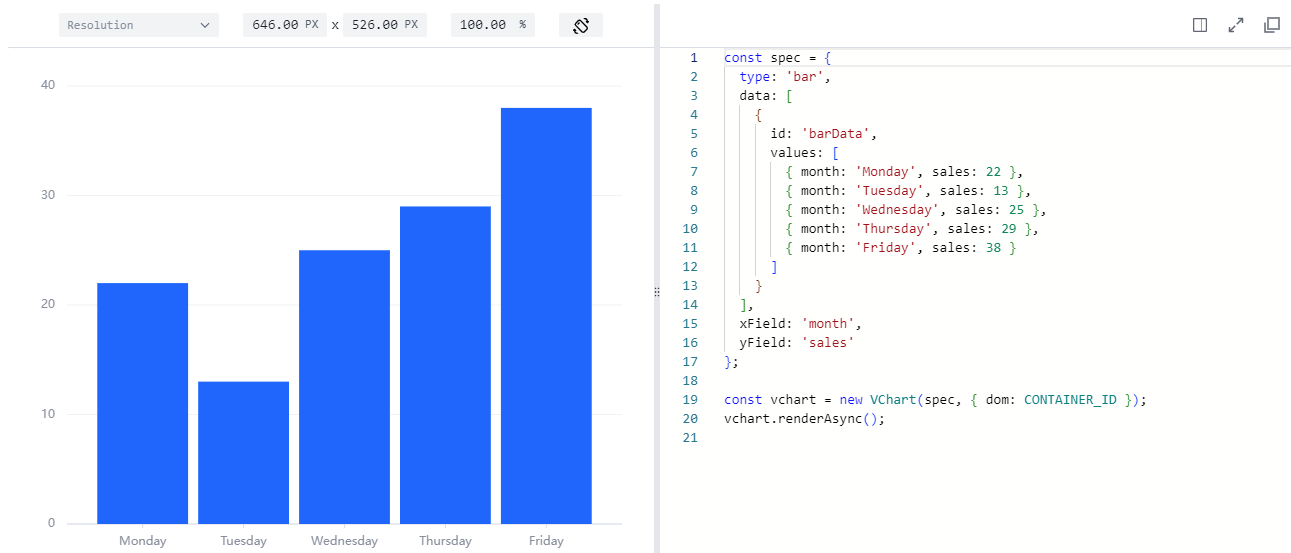
接下来,我们创建一个 VChart 实例,将图表配置选项和 DOM 容器的 ID 作为参数传入:
const spec = {data: [{id: 'barData',values: [{ month: 'Monday', sales: 22 },{ month: 'Tuesday', sales: 13 },{ month: 'Wednesday', sales: 25 },{ month: 'Thursday', sales: 29 },{ month: 'Friday', sales: 38 }]}],type: 'bar',xField: 'month',yField: 'sales'};// Create a vchart instanceconst vchart = new VChart(spec, { dom: 'chart' });// Draw the chartvchart.renderAsync();
至此,你已经成功绘制了一个简单的条形图!
我希望这个教程能够帮助你学习如何使用 VChart。现在,你可以尝试绘制不同类型的图表,并通过深入研究 VChart 中的各种配置选项来定制更多多样化的图表效果。充满信心地开始你的 VChart 之旅吧!

若有收获,就点个赞吧
0 人点赞
