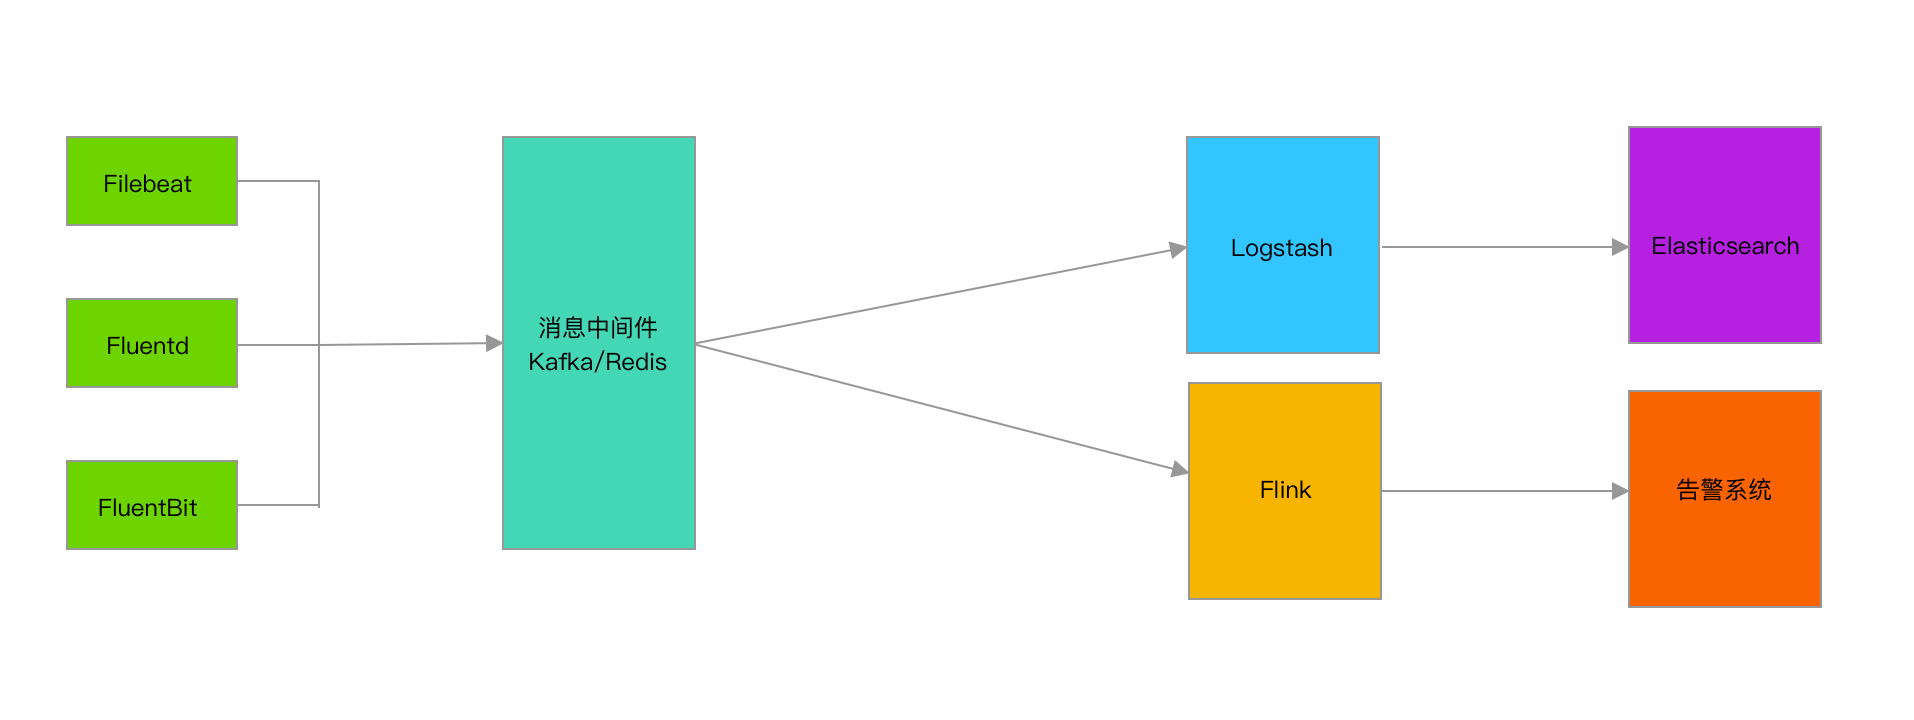
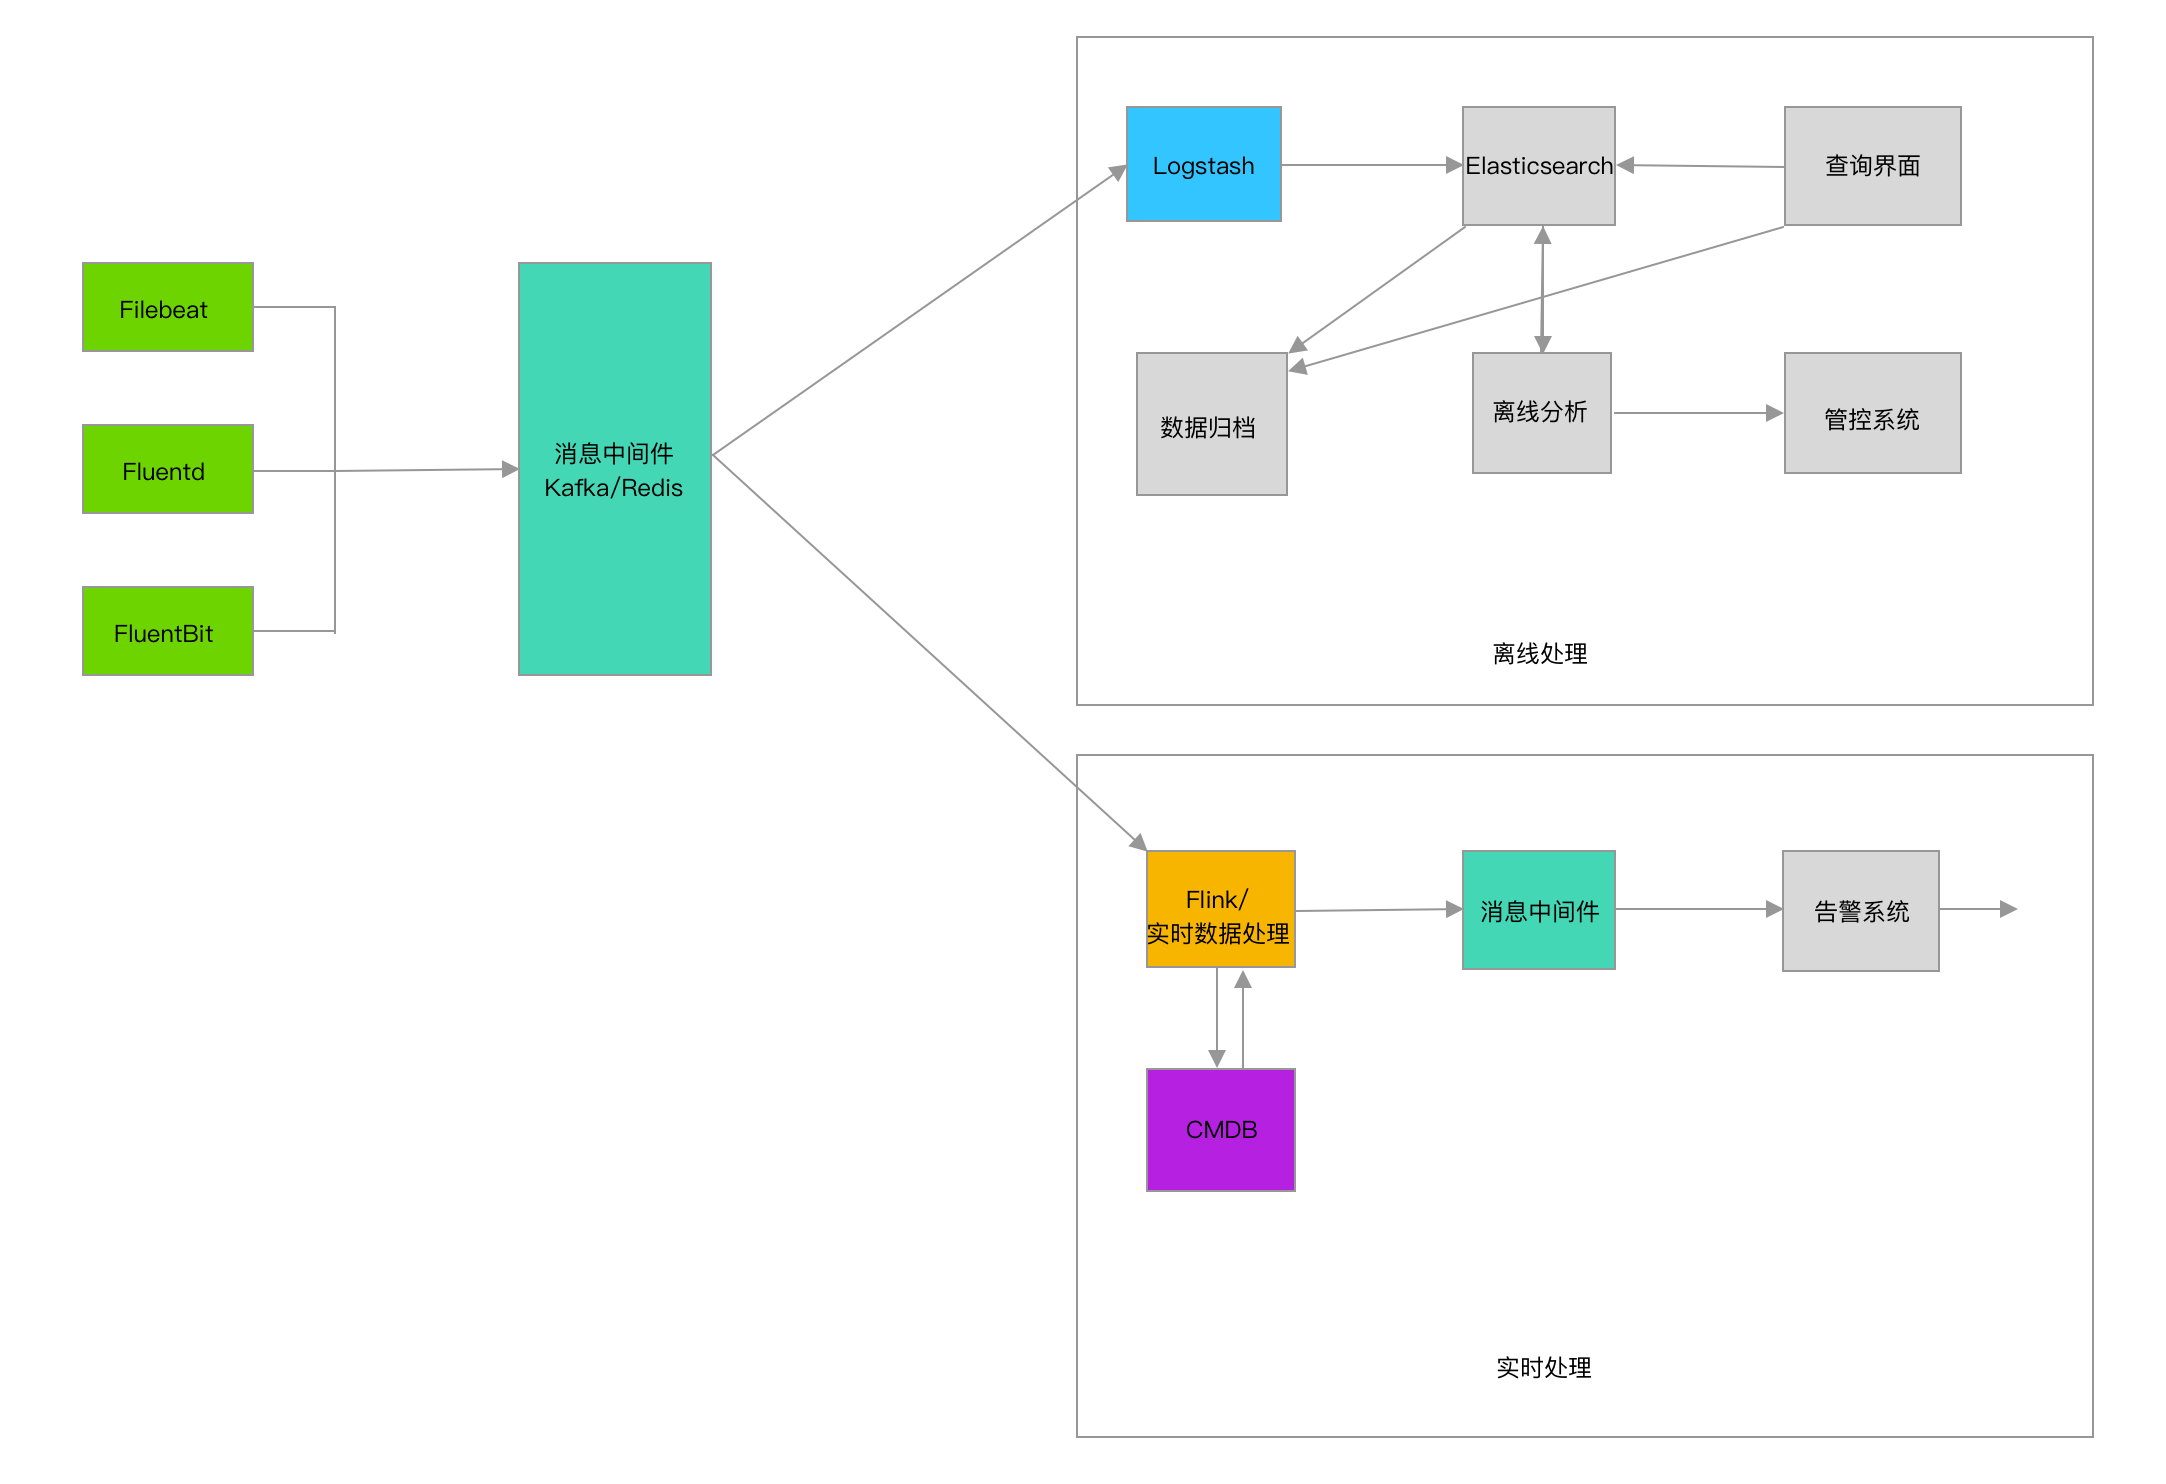
ELK
架构图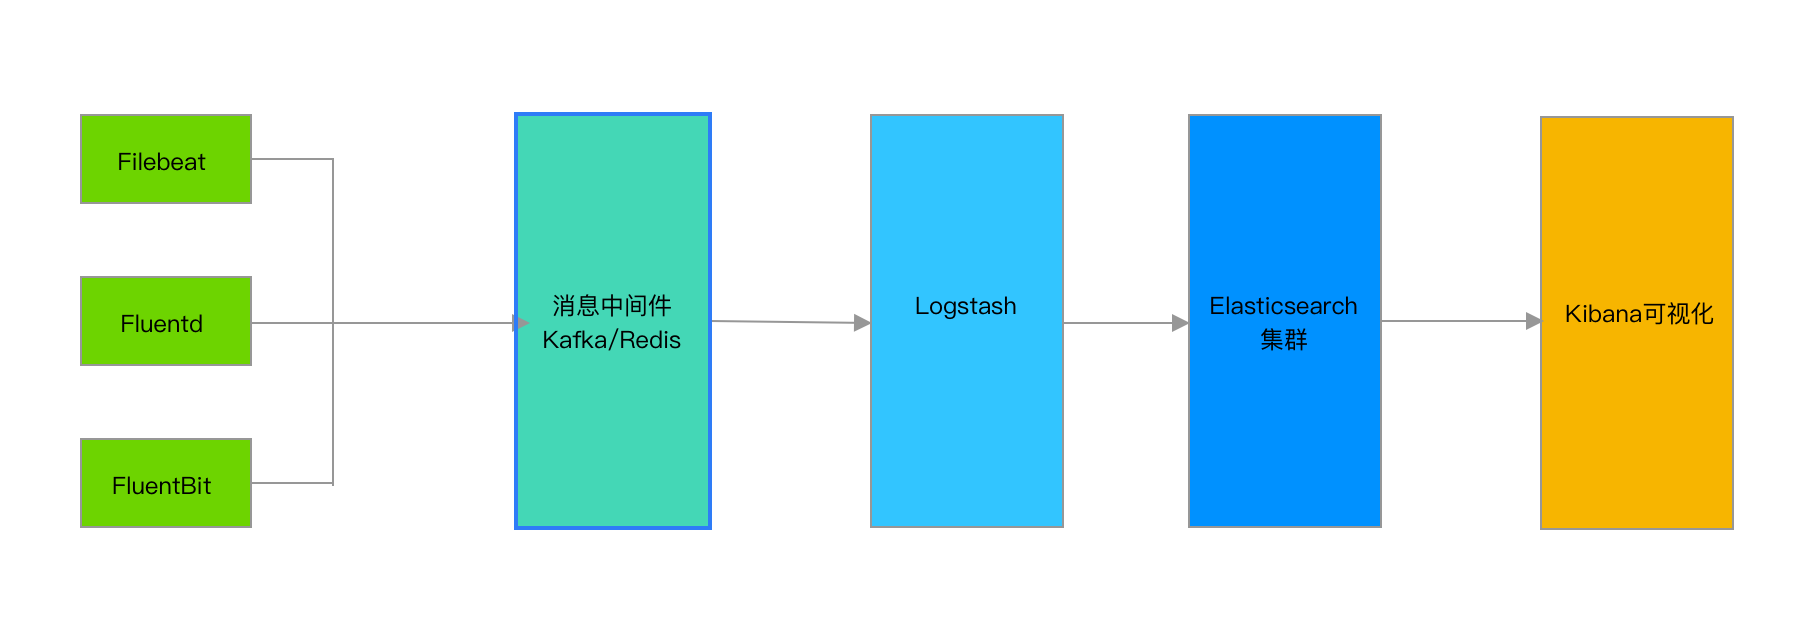
Logstash高可用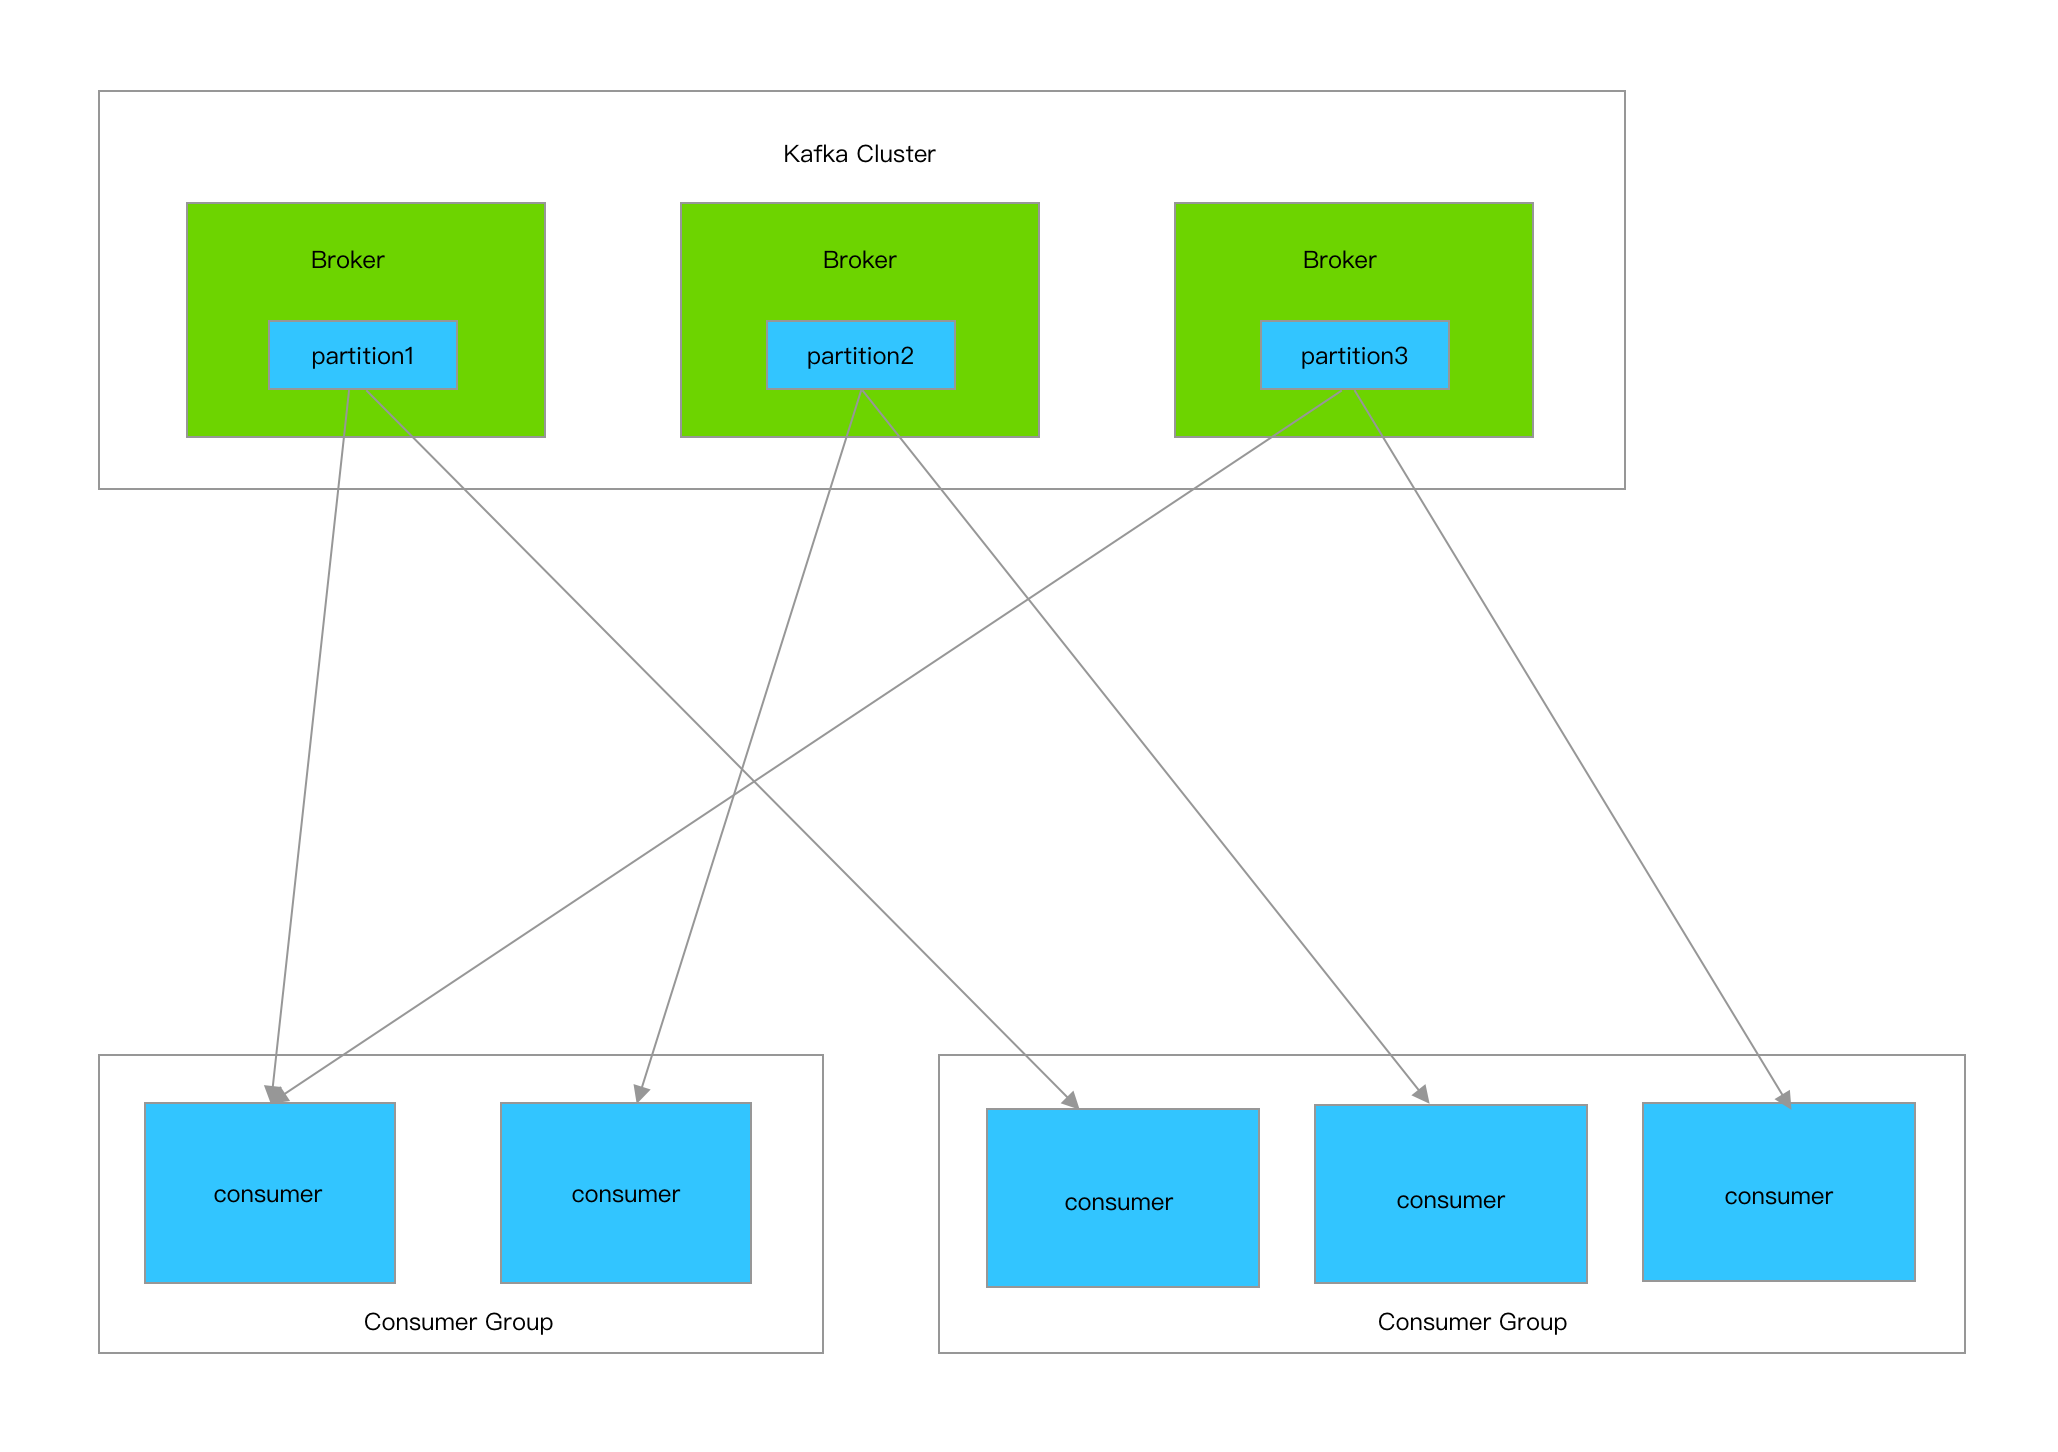
Broker: 一台kafka服务器就是一个broker,一个kafka集群由多个broker组成,上图中的kafka集群有3台kafka服务器组成,也就是有3个broker,一个broker上可以有多个topic
Topic: 是个逻辑上的概念,用来区分不同的消息类别,类似于数据库中的表,可以将一组相同的数据发送给一个Topic,在日志处理中通常会将不同类型的日志写入不同的Topic,例如nginx日志写入名字为nginx_log的topic,tomcat日志写入名字为tomcat_log的topic,topic上图中没有标出,我们可以理解为图上的三个partition构成了一个topic
Partition: 是kafka数据存储的基本物理单元,同一个Topic的数据可以被存储在一个或多个partition中,例如上图中的一个topic数据被存储在了partition1,partition2,partition3中,通常我们设置一个topic下partition的数量为broker的整数倍,这样一来数据能够均匀分布,二来可以同时利用集群下的所有服务器资源
Producer: 生产者,向kafka写数据的服务,例如filebeat
Consumer: 消费者,去kafka取数据的服务,例如logstash
Consumer Group: 也是个逻辑上的概念,为一组consumer的集合,同一个topic的数据会广播给不同的group,同一个group中只有一个consumer能拿到这个数据
也就是说对于同一个topic,每个group都可以拿到同样的所有数据,但是数据进入group后只能被其中的一个consumer消费,基于这一点我们只需要启动多个logstash,并将这些logstash分配在同一个组里边就可以实现logstash的高可用了
input {
kafka {
bootstrapservers => “10.8.9.2:9092,10.8.9.3:9092,10.8.9.4:9092”
topics => [“ops_coffee_cn”]
group_id => “groupA”
codec => “json”
}
}
以上为logstash消费kafka集群的配置,其中加入了group_id参数,group_id是一个的字符串,唯一标识一个group,具有相同group_id的consumer构成了一个consumer group,这样启动多个logstash进程,只需要保证group_id一致就能达到logstash高可用的目的,一个logstash挂掉同一Group内的logstash可以继续消费
除了高可用外同一Group内的多个Logstash可以同时消费kafka内topic的数据,从而提高logstash的处理能力,但需要注意的是消费kafka数据时,每个consumer最多只能使用一个partition,当一个Group内consumer的数量大于partition的数量时,只有等于partition个数的consumer能同时消费,其他的consumer处于等待状态
例如一个topic下有3个partition,那么在一个有5个consumer的group中只有3个consumer在同时消费topic的数据,而另外两个consumer处于等待状态,所以想要增加logstash的消费性能,可以适当的增加topic的partition数量,但kafka中partition数量过多也会导致kafka集群故障恢复时间过长,消耗更多的文件句柄与客户端内存等问题,也并不是partition配置越多越好,需要在使用中找到一个平衡
环境
[root@LF-MYSQL-136-130 ll]# /root/k8s.sh ht -n loki get pod -o wide|grep elk
elk-elasticsearch1 1/1 Running 0 6h 11.45.199.238 11.5.80.42
elk-elasticsearch2 1/1 Running 0 6h 11.45.199.239 11.5.80.36
elk-elasticsearch3 1/1 Running 0 6h 11.45.199.240 11.5.80.172
elk-kafka1 1/1 Running 0 6h 11.45.199.233 11.5.80.36
elk-kafka2 1/1 Running 0 6h 11.45.199.234 11.5.80.36
elk-kafka3 1/1 Running 0 6h 11.45.199.235 11.5.80.36
elk-kibana 1/1 Running 0 6h 11.45.199.241 11.5.80.168
elk-logstash1 1/1 Running 0 2h 11.45.199.243 11.5.80.172 #非高可用
elk-logstash2 1/1 Running 0 2h 11.45.199.244 11.5.80.168 #高可用
elk-logstash3 1/1 Running 0 13s 11.45.199.245 11.5.80.133 #高可用
elk-zookeeper1 1/1 Running 0 6h 11.45.199.236 11.5.80.36
elk-zookeeper2 1/1 Running 0 6h 11.45.235.46 11.5.96.233
elk-zookeeper3 1/1 Running 0 6h 11.45.199.237 11.5.80.98
Zookeeper
#配置文件
[root@elk-zookeeper1 zookeeper]# more conf/zoo.cfg
# The number of milliseconds of each tick
tickTime=2000
# The number of ticks that the initial
# synchronization phase can take
initLimit=10
# The number of ticks that can pass between
# sending a request and getting an acknowledgement
syncLimit=5
# the directory where the snapshot is stored.
# do not use /tmp for storage, /tmp here is just
# example sakes.
dataDir=/export/zookeeper/data
# the port at which the clients will connect
clientPort=2181
# the maximum number of client connections.
# increase this if you need to handle more clients
#maxClientCnxns=60
#
# Be sure to read the maintenance section of the
# administrator guide before turning on autopurge.
#
# http://zookeeper.apache.org/doc/current/zookeeperAdmin.html#sc_maintenance
#
# The number of snapshots to retain in dataDir
#autopurge.snapRetainCount=3
# Purge task interval in hours
# Set to “0” to disable auto purge feature
#autopurge.purgeInterval=1
## Metrics Providers
#
# https://prometheus.io Metrics Exporter
#metricsProvider.className=org.apache.zookeeper.metrics.prometheus.PrometheusMetricsProvider
#metricsProvider.httpPort=7000
#metricsProvider.exportJvmInfo=true
server.1=11.45.199.236:2888:3888
server.2=11.45.235.46:2888:3888
server.3=11.45.199.237:2888:3888
[root@elk-zookeeper1 zookeeper]# cd /export/zookeeper/data; echo 1 > myid
[root@elk-zookeeper2 zookeeper]# cd /export/zookeeper/data; echo 2 > myid
[root@elk-zookeeper3 zookeeper]# cd /export/zookeeper/data; echo 3 > myid
#myid文件中的内容是否和zoo.cfg中相对应
#启动
[root@elk-zookeeper2 bin]# ./zkServer.sh start
/usr/bin/java
ZooKeeper JMX enabled by default
Using config: /export/zookeeper/bin/../conf/zoo.cfg
Starting zookeeper … STARTED
#查看状态
[root@elk-zookeeper2 bin]# ./zkServer.sh status
/usr/bin/java
ZooKeeper JMX enabled by default
Using config: /export/zookeeper/bin/../conf/zoo.cfg
Client port found: 2181. Client address: localhost. Client SSL: false.
Mode: leader
[root@elk-zookeeper1 bin]# ./zkServer.sh status
/usr/bin/java
ZooKeeper JMX enabled by default
Using config: /export/zookeeper/bin/../conf/zoo.cfg
Client port found: 2181. Client address: localhost. Client SSL: false.
Mode: follower
Kafka
#配置文件
[root@elk-kafka1 config]# cat server.properties
# Licensed to the Apache Software Foundation (ASF) under one or more
# contributor license agreements. See the NOTICE file distributed with
# this work for additional information regarding copyright ownership.
# The ASF licenses this file to You under the Apache License, Version 2.0
# (the “License”); you may not use this file except in compliance with
# the License. You may obtain a copy of the License at
#
# http://www.apache.org/licenses/LICENSE-2.0
#
# Unless required by applicable law or agreed to in writing, software
# distributed under the License is distributed on an “AS IS” BASIS,
# WITHOUT WARRANTIES OR CONDITIONS OF ANY KIND, either express or implied.
# See the License for the specific language governing permissions and
# limitations under the License.
# see kafka.server.KafkaConfig for additional details and defaults
############################# Server Basics #############################
# The id of the broker. This must be set to a unique integer for each broker.
broker.id=1
port=9092
host.name=11.45.199.233
############################# Socket Server Settings #############################
# The address the socket server listens on. It will get the value returned from
# java.net.InetAddress.getCanonicalHostName() if not configured.
# FORMAT:
# listeners = listener_name://host_name:port
# EXAMPLE:
# listeners = PLAINTEXT://your.host.name:9092
#listeners=PLAINTEXT://:9092
# Hostname and port the broker will advertise to producers and consumers. If not set,
# it uses the value for “listeners” if configured. Otherwise, it will use the value
# returned from java.net.InetAddress.getCanonicalHostName().
#advertised.listeners=PLAINTEXT://your.host.name:9092
# Maps listener names to security protocols, the default is for them to be the same. See the config documentation for more details
#listener.security.protocol.map=PLAINTEXT:PLAINTEXT,SSL:SSL,SASL_PLAINTEXT:SASL_PLAINTEXT,SASL_SSL:SASL_SSL
# The number of threads that the server uses for receiving requests from the network and sending responses to the network
num.network.threads=3
# The number of threads that the server uses for processing requests, which may include disk I/O
num.io.threads=8
# The send buffer (SO_SNDBUF) used by the socket server
socket.send.buffer.bytes=102400
# The receive buffer (SO_RCVBUF) used by the socket server
socket.receive.buffer.bytes=102400
# The maximum size of a request that the socket server will accept (protection against OOM)
socket.request.max.bytes=104857600
############################# Log Basics #############################
# A comma separated list of directories under which to store log files
log.dirs=/export/kafka/logs
# The default number of log partitions per topic. More partitions allow greater
# parallelism for consumption, but this will also result in more files across
# the brokers.
num.partitions=1
# The number of threads per data directory to be used for log recovery at startup and flushing at shutdown.
# This value is recommended to be increased for installations with data dirs located in RAID array.
num.recovery.threads.per.data.dir=1
############################# Internal Topic Settings #############################
# The replication factor for the group metadata internal topics “consumer_offsets” and “transaction_state”
# For anything other than development testing, a value greater than 1 is recommended to ensure availability such as 3.
offsets.topic.replication.factor=1
transaction.state.log.replication.factor=1
transaction.state.log.min.isr=1
############################# Log Flush Policy #############################
# Messages are immediately written to the filesystem but by default we only fsync() to sync
# the OS cache lazily. The following configurations control the flush of data to disk.
# There are a few important trade-offs here:
# 1. Durability: Unflushed data may be lost if you are not using replication.
# 2. Latency: Very large flush intervals may lead to latency spikes when the flush does occur as there will be a lot of data to flush.
# 3. Throughput: The flush is generally the most expensive operation, and a small flush interval may lead to excessive seeks.
# The settings below allow one to configure the flush policy to flush data after a period of time or
# every N messages (or both). This can be done globally and overridden on a per-topic basis.
# The number of messages to accept before forcing a flush of data to disk
#log.flush.interval.messages=10000
# The maximum amount of time a message can sit in a log before we force a flush
#log.flush.interval.ms=1000
############################# Log Retention Policy #############################
# The following configurations control the disposal of log segments. The policy can
# be set to delete segments after a period of time, or after a given size has accumulated.
# A segment will be deleted whenever either of these criteria are met. Deletion always happens
# from the end of the log.
# The minimum age of a log file to be eligible for deletion due to age
log.retention.hours=168
# A size-based retention policy for logs. Segments are pruned from the log unless the remaining
# segments drop below log.retention.bytes. Functions independently of log.retention.hours.
#log.retention.bytes=1073741824
# The maximum size of a log segment file. When this size is reached a new log segment will be created.
log.segment.bytes=1073741824
# The interval at which log segments are checked to see if they can be deleted according
# to the retention policies
log.retention.check.interval.ms=300000
############################# Zookeeper #############################
# Zookeeper connection string (see zookeeper docs for details).
# This is a comma separated host:port pairs, each corresponding to a zk
# server. e.g. “127.0.0.1:3000,127.0.0.1:3001,127.0.0.1:3002”.
# You can also append an optional chroot string to the urls to specify the
# root directory for all kafka znodes.
zookeeper.connect=11.45.199.236:2181,11.45.235.46:2181,11.45.199.237:2181
# Timeout in ms for connecting to zookeeper
zookeeper.connection.timeout.ms=6000
############################# Group Coordinator Settings #############################
# The following configuration specifies the time, in milliseconds, that the GroupCoordinator will delay the initial consumer rebalance.
# The rebalance will be further delayed by the value of group.initial.rebalance.delay.ms as new members join the group, up to a maximum of max.poll.interval.ms.
# The default value for this is 3 seconds.
# We override this to 0 here as it makes for a better out-of-the-box experience for development and testing.
# However, in production environments the default value of 3 seconds is more suitable as this will help to avoid unnecessary, and potentially expensive, rebalances during application startup.
group.initial.rebalance.delay.ms=0
#启动
[root@elk-kafka1 bin]# ./kafka-server-start.sh -daemon /export/kafka/config/server.properties
[root@elk-kafka1 bin]# jps
10865 Jps
10716 Kafka
#基本使用
#查看topic 列表
./kafka-topics.sh —list —zookeeper 11.45.199.236:2181,11.45.235.46:2181,11.45.199.237:2181
#查看指定topic
./kafka-topics.sh —describe —zookeeper 11.45.199.236:2181,11.45.235.46:2181,11.45.199.237:2181 —topic test_topic
#创建topic
# —create:表示创建
# —zookeeper 后面的参数是zk的集群节点
# —replication-factor 1 :表示复本数
# —partitions 1:表示分区数
# —topic itheima_topic:表示topic的主题名称
[root@elk-kafka1 bin]# ./kafka-topics.sh —create —zookeeper 11.45.199.236:2181,11.45.235.46:2181,11.45.199.237:2181 —replication-factor 1 —partitions 1 —topic test_topic
WARNING: Due to limitations in metric names, topics with a period (‘.’) or underscore (‘‘) could collide. To avoid issues it is best to use either, but not both.
Created topic testtopic.
[root@elk-kafka1 bin]# ./kafka-topics.sh —list —zookeeper 11.45.199.236:2181,11.45.235.46:2181,11.45.199.237:2181
test_topic
[root@elk-kafka1 bin]# ./kafka-topics.sh —describe —zookeeper 11.45.199.236:2181,11.45.235.46:2181,11.45.199.237:2181 —topic test_topic
Topic: test_topic PartitionCount: 1 ReplicationFactor: 1 Configs:
Topic: test_topic Partition: 0 Leader: 3 Replicas: 3 Isr: 3
#删除topic
[root@elk-kafka1 bin]# ./kafka-topics.sh —create —zookeeper 11.45.199.236:2181,11.45.235.46:2181,11.45.199.237:2181 —replication-factor 1 —partitions 1 —topic test_topic1
WARNING: Due to limitations in metric names, topics with a period (‘.’) or underscore (‘‘) could collide. To avoid issues it is best to use either, but not both.
Created topic test_topic1.
[root@elk-kafka1 bin]# ./kafka-topics.sh —delete —zookeeper 11.45.199.236:2181,11.45.235.46:2181,11.45.199.237:2181 —topic test_topic1
Topic test_topic1 is marked for deletion.
Note: This will have no impact if delete.topic.enable is not set to true.
#测试
#创建生产者,生产消息
[root@elk-kafka1 bin]# ./kafka-console-producer.sh —broker-list 11.45.199.233:9092,11.45.199.234:9092,11.45.199.235:9092 —topic test_topic
>[2020-12-30 03:38:26,431] WARN [Producer clientId=console-producer] Bootstrap broker 11.45.199.233:9092 (id: -1 rack: null) disconnected (org.apache.kafka.clients.NetworkClient)
hello world
>hello again
>hello again again
#创建消费者,消费消息
[root@elk-kafka2 bin]# ./kafka-console-consumer.sh —bootstrap-server 11.45.199.233:9092,11.45.199.234:9092,11.45.199.235:9092 —topic test_topic —from-beginning
hello world
hello again
hello again again
elasticsearch
#修改文件描述符数目
vim /etc/profile
ulimit -n 65535
vim /etc/security/limits.conf
soft nofile 65536
hard nofile 65536
soft nproc 2048
hard nproc 4096
#切换到Elasticsearch用户,使用ulimit -a 查看是否修改成功
ulimit -a
#修改 最大映射数量 MMP
vim /etc/sysctl.conf
vm.max_map_count=655360
fs.file-max=655360
#使生效
sysctl -p
#elasticsearch配置文件
[elasticsearch@elk-elasticsearch1 elasticsearch]$ more config/elasticsearch.yml
cluster.name: elk
path.logs: /export/elasticsearch/logs
path.data: /export/elasticsearch/data
node.name: 11.45.199.238
node.master: true
node.data: true
node.ingest: false
node.ml: false
network.host: 11.45.199.238
discovery.seed_hosts: [“11.45.199.238”,”11.45.199.239”,”11.45.199.240”]
cluster.initial_master_nodes: [“11.45.199.238”,”11.45.199.239”,”11.45.199.240”]
xpack.ml.enabled: false
xpack.monitoring.enabled: false
xpack.watcher.enabled: false
xpack.security.enabled : false
node.attr.tag: hot
node.attr.rack_id: empty
node.attr.zone: test
#启动
bin/elasticsearch -d
#查看集群状态
curl http://11.45.199.238:9200/_cat/nodes
11.45.199.240 8 99 55 0.88 1.41 1.36 cdhmrstw - 11.45.199.240
11.45.199.238 25 68 39 2.25 3.30 2.87 cdhmrstw 11.45.199.238
11.45.199.239 23 100 58 3.86 3.88 4.27 cdhmrstw - 11.45.199.239
[root@LF-MYSQL-136-130 ll]# curl http://11.45.199.239:9200/_cat/health
1609309475 06:24:35 elk green 3 3 0 0 0 0 0 0 - 100.0%
kibana
#配置文件
[root@elk-kibana kibana]# more config/kibana.yml
# Kibana is served by a back end server. This setting specifies the port to use.#server.port: 5601
server.port: 80
# Specifies the address to which the Kibana server will bind. IP addresses and host names are both valid values.
# The default is ‘localhost’, which usually means remote machines will not be able to connect.
# To allow connections from remote users, set this parameter to a non-loopback address.
#server.host: “localhost”
server.host: “11.45.199.241”
# The URLs of the Elasticsearch instances to use for all your queries.
elasticsearch.hosts: [“http://11.45.199.238:9200","http://11.45.199.239:9200","http://11.45.199.240:9200“]
#浏览器访问
http://11.45.199.241/app/dev_tools#/console
配置
[root@elk-kafka1 bin]# ./kafka-topics.sh —create —zookeeper 11.45.199.236:2181,11.45.235.46:2181,11.45.199.237:2181 —replication-factor 1 —partitions 1 —topic elk_lower_topic
[root@elk-kafka1 bin]# ./kafka-topics.sh —create —zookeeper 11.45.199.236:2181,11.45.235.46:2181,11.45.199.237:2181 —replication-factor 1 —partitions 2 —topic elk_higher_topic
logstash
https://www.elastic.co/guide/en/logstash/current/config-setting-files.html
无高可用(logstash1)
#配置文件
[root@elk-logstash1] mkdir my_conf
[root@elk-logstash1 my_conf]# ll
total 8
-rw-r—r— 1 root root 236 Dec 30 06:34 input.conf
-rw-r—r— 1 root root 207 Dec 30 06:34 output.conf
[root@elk-logstash1 my_conf]# more input.conf
input{
kafka{
type => “lower_kafka”
codec => “json”
topics => “elk_lower_topic”
decorate_events => true
bootstrap_servers => “11.45.199.233:9092,11.45.199.234:9092,11.45.199.235:9092”
}
}
[root@elk-logstash1 my_conf]# more output.conf
output {
if[type] == “lower_kafka” {
elasticsearch {
hosts => [“11.45.199.238”,”11.45.199.239”,”11.45.199.240”]
index => ‘logstash-lower-%{+YYYY-MM-dd}’
}
}
}
#启动
./bin/logstash -f ./my_conf/ —config.reload.automatic
filebeat
#采集nginx日志
#配置文件
[root@LF-MYSQL-136-130 filebeat]# more filebeat.yml
filebeat.inputs:
- type: log
paths:
- /export/.trash/haha/ll/nohup.out
output.kafka:
hosts: [“11.45.199.233:9092”, “11.45.199.234:9092”, “11.45.199.235:9092”]
topic: ‘elk_lower_topic’
#启动命令
./filebeat -e -c filebeat.yml
nohup ./filebeat -e -c filebeat_higher.yml &
kibana查看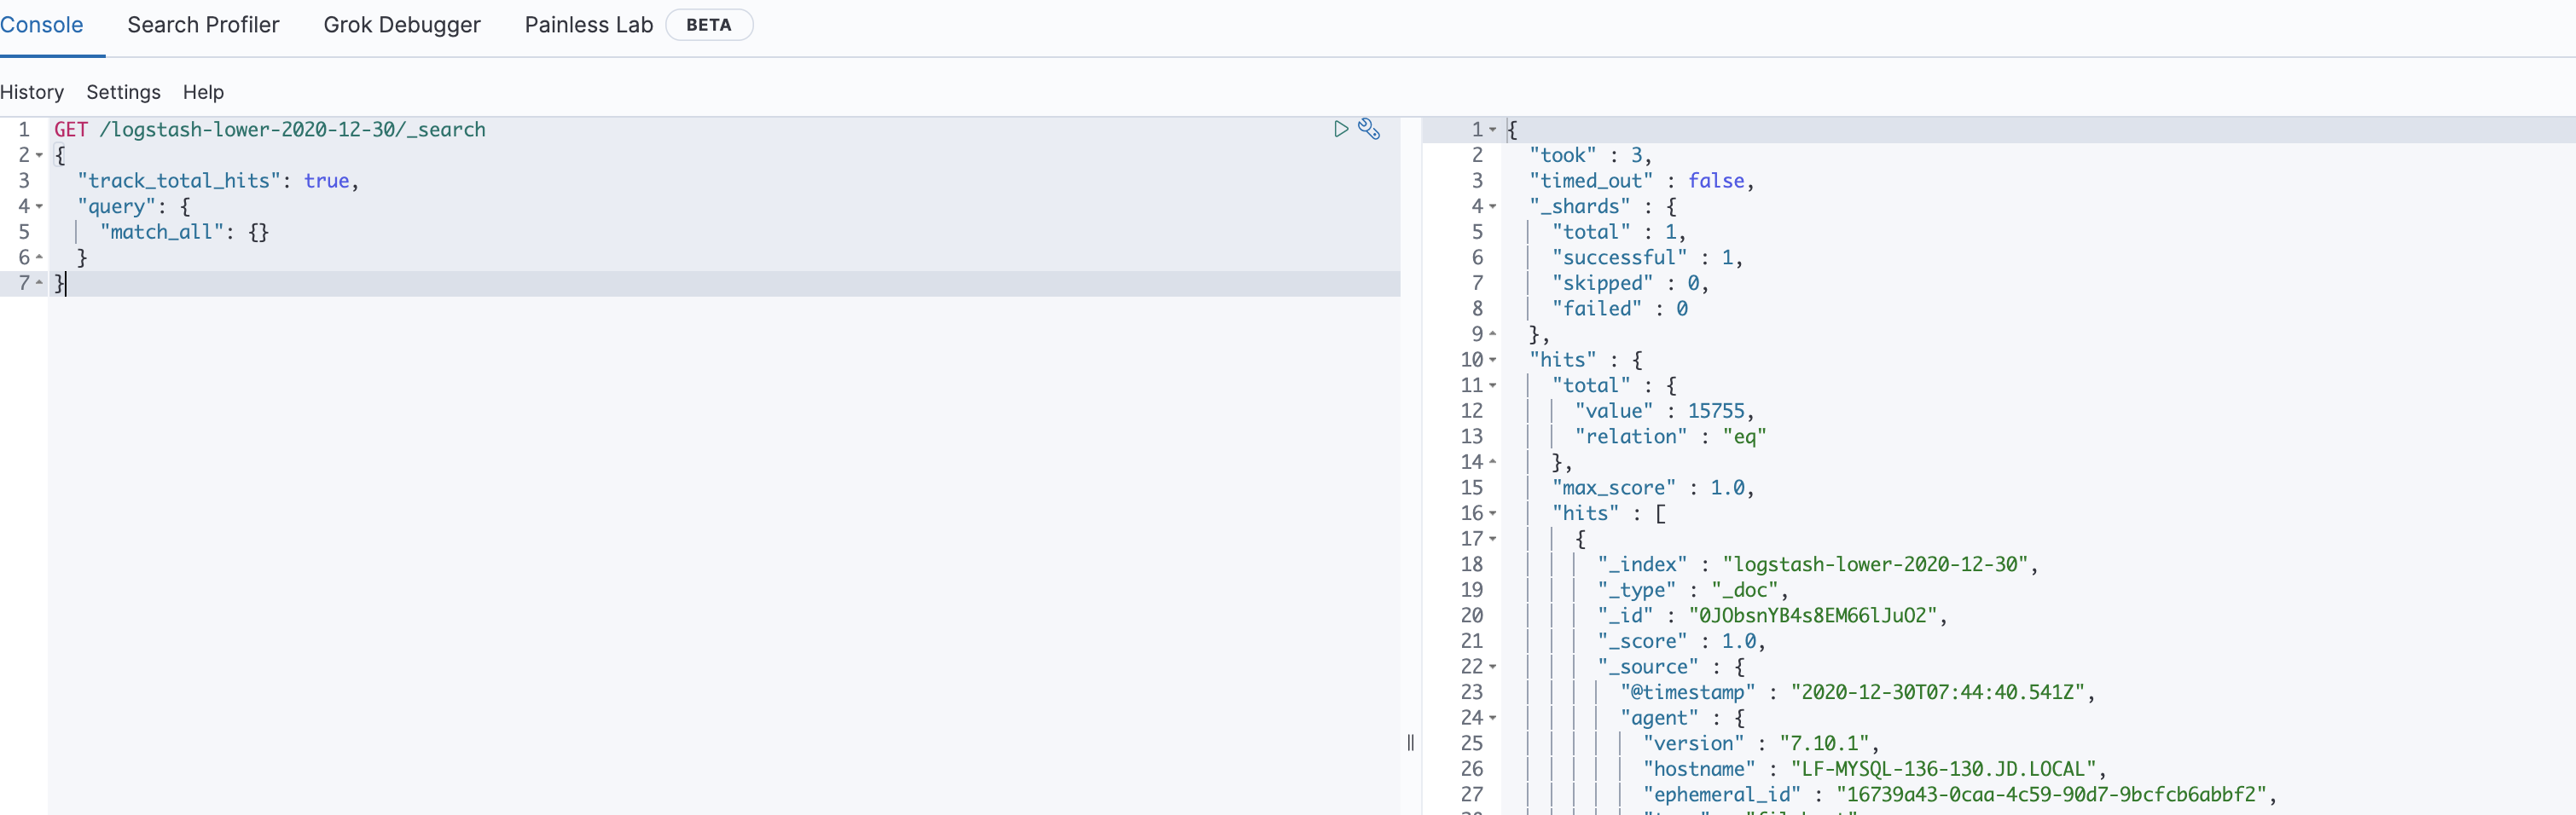
[root@LF-MYSQL-136-130 ll]# curl http://11.45.199.239:9200/_cat/indices
green open .apm-custom-link PlerqpqGSmubEQsz2jS7eg 1 1 0 0 416b 208b
green open .kibana_task_manager_1 _KbK1iwVQBWoTrgNszJWtg 1 1 5 159 141.8kb 94.8kb
green open .apm-agent-configuration zX030uSFSFWgzGUnNn2shA 1 1 0 0 416b 208b
green open .kibana-event-log-7.10.1-000001 8mQGHVoQRciTTwGgo7D1kQ 1 1 1 0 11.2kb 5.6kb
green open logstash-lower-2020-12-30 gsYBBGshTUyyEYce5azlJg 1 1 15600 0 2.3mb 1.1mb
green open .kibana_1 b7ujcXvlRAuAKTTQ-Rfhgw 1 1 9 0 4.2mb 2.1mb
[root@LF-MYSQL-136-130 ll]# curl http://11.45.199.239:9200/_cat/indices
green open .apm-custom-link PlerqpqGSmubEQsz2jS7eg 1 1 0 0 416b 208b
green open .kibana_task_manager_1 _KbK1iwVQBWoTrgNszJWtg 1 1 5 171 227.1kb 85.2kb
green open .apm-agent-configuration zX030uSFSFWgzGUnNn2shA 1 1 0 0 416b 208b
green open .kibana-event-log-7.10.1-000001 8mQGHVoQRciTTwGgo7D1kQ 1 1 1 0 11.2kb 5.6kb
green open logstash-lower-2020-12-30 gsYBBGshTUyyEYce5azlJg 1 1 15637 0 2.3mb 1.1mb
green open .kibana_1 b7ujcXvlRAuAKTTQ-Rfhgw 1 1 9 0 4.2mb 2.1mb
[root@LF-MYSQL-136-130 ll]# curl http://11.45.199.239:9200/_cat/indices
green open .apm-custom-link PlerqpqGSmubEQsz2jS7eg 1 1 0 0 416b 208b
green open .kibana_task_manager_1 _KbK1iwVQBWoTrgNszJWtg 1 1 5 210 212.4kb 77.4kb
green open .apm-agent-configuration zX030uSFSFWgzGUnNn2shA 1 1 0 0 416b 208b
green open .kibana-event-log-7.10.1-000001 8mQGHVoQRciTTwGgo7D1kQ 1 1 3 0 22.6kb 11.3kb
green open logstash-lower-2020-12-30 gsYBBGshTUyyEYce5azlJg 1 1 15777 0 2.3mb 1.2mb
green open .kibana_1 b7ujcXvlRAuAKTTQ-Rfhgw 1 1 29 19 5.2mb 2.6mb
logstash
高可用(logstash2,logstash3)
#配置文件
[root@elk-logstash2] mkdir my_conf
[root@elk-logstash2 my_conf]# more input.conf
input{
kafka{
type => “higher_kafka”
codec => “json”
topics => “elk_higher_topic”
group_id => “higher”
decorate_events => true
bootstrap_servers => “11.45.199.233:9092,11.45.199.234:9092,11.45.199.235:9092”
}
}
[root@elk-logstash2 my_conf]# more output.conf
output {
if[type] == “higher_kafka” {
elasticsearch {
hosts => [“11.45.199.238”,”11.45.199.239”,”11.45.199.240”]
index => ‘logstash-higher-%{+YYYY-MM-dd}’
}
}
}
#启动
./bin/logstash -f ./my_conf/ —config.reload.automatic
filebeat
#采集nginx日志
#配置文件
[root@LF-MYSQL-136-130 filebeat]# more filebeat_higher.yml
filebeat.inputs:
- type: log
paths:
- /export/.trash/haha/ll/nohup.out
output.kafka:
hosts: [“11.45.199.233:9092”, “11.45.199.234:9092”, “11.45.199.235:9092”]
topic: ‘elk_higher_topic’
#启动命令
./filebeat -e -c filebeat_higher.yml
nohup ./filebeat -e -c filebeat_higher.yml > nohup_higher.out &
*kibana查看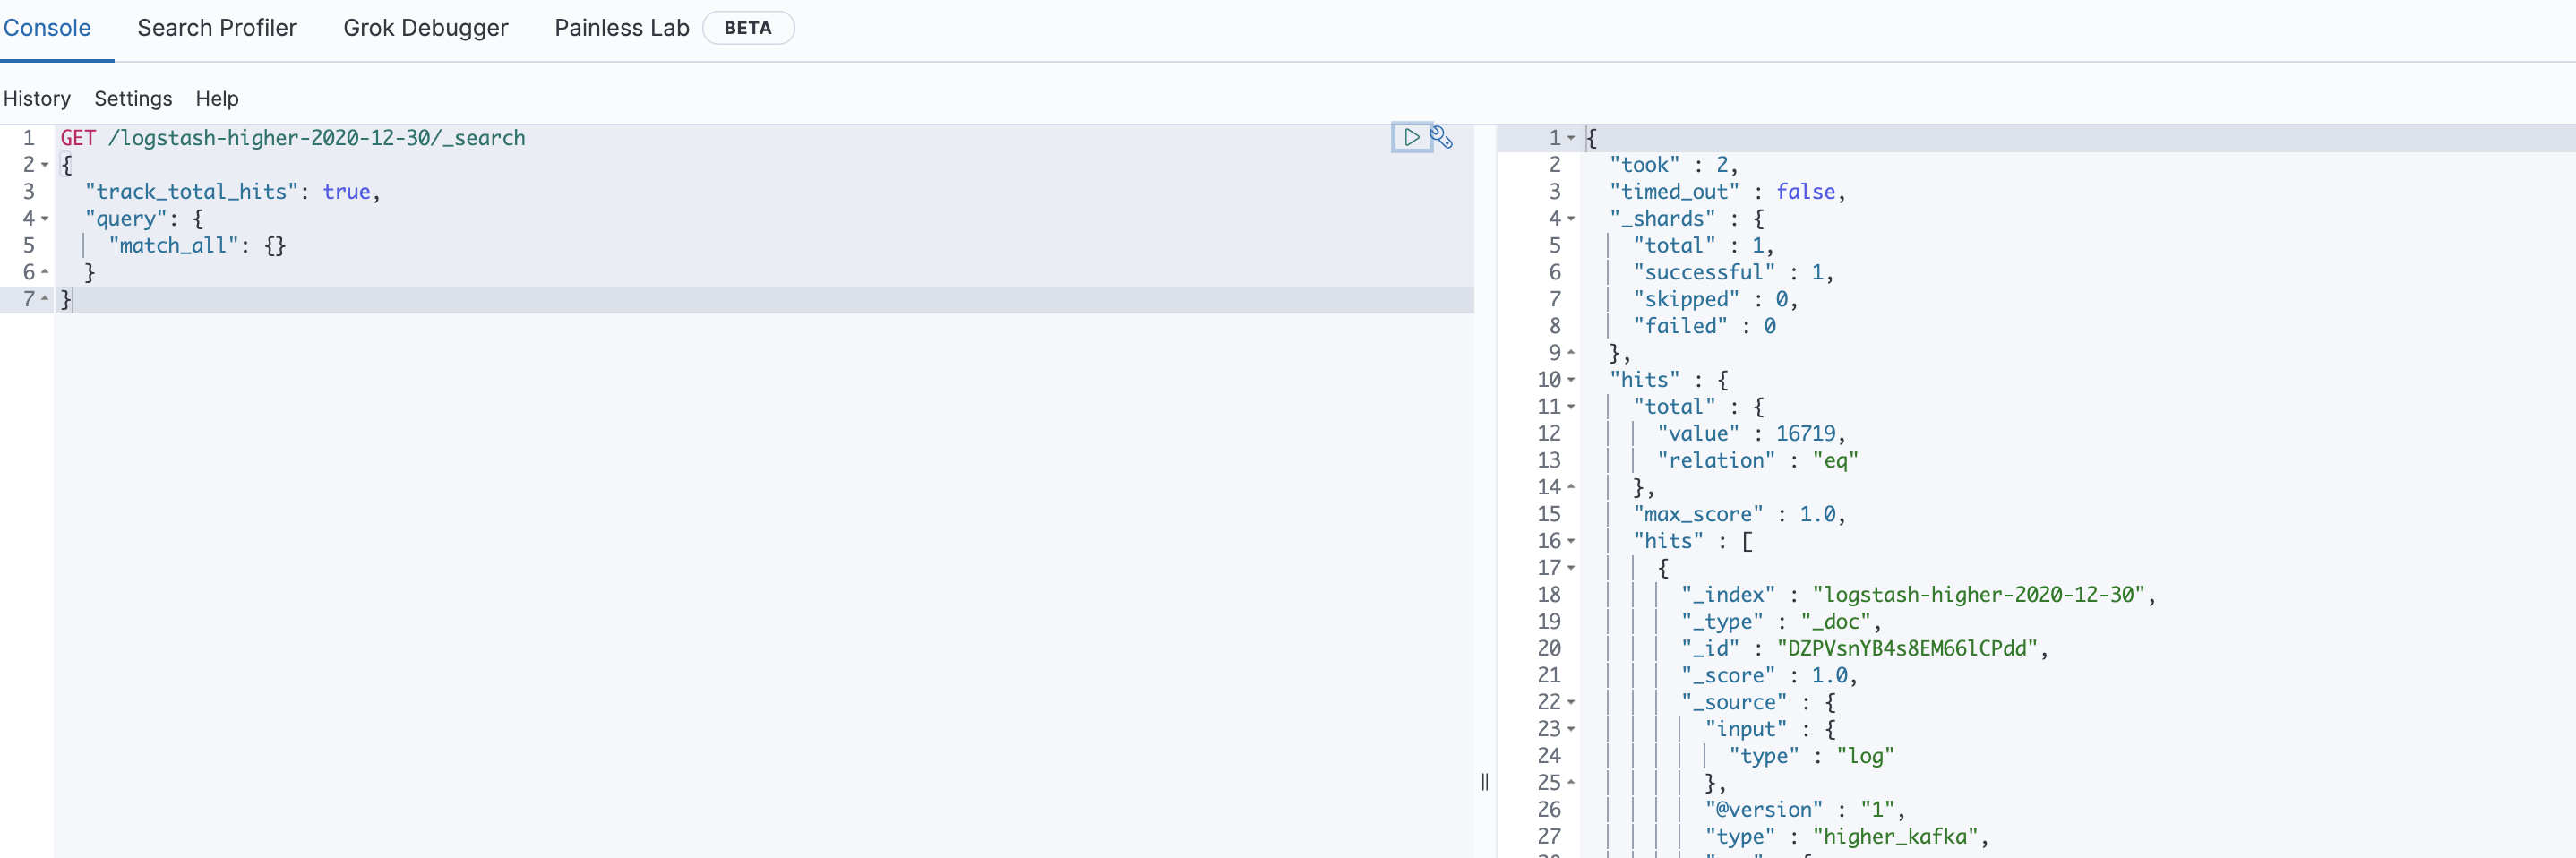
[root@LF-MYSQL-136-130 haha]# curl http://11.45.199.239:9200/_cat/indices?v
health status index uuid pri rep docs.count docs.deleted store.size pri.store.size
green open .apm-custom-link PlerqpqGSmubEQsz2jS7eg 1 1 0 0 416b 208b
green open .kibana_task_manager_1 _KbK1iwVQBWoTrgNszJWtg 1 1 5 330 208.5kb 126.4kb
green open .apm-agent-configuration zX030uSFSFWgzGUnNn2shA 1 1 0 0 416b 208b
green open .kibana-event-log-7.10.1-000001 8mQGHVoQRciTTwGgo7D1kQ 1 1 3 0 22.6kb 11.3kb
green open logstash-lower-2020-12-30 gsYBBGshTUyyEYce5azlJg 1 1 16713 0 2.5mb 1.2mb
green open .kibana_1 b7ujcXvlRAuAKTTQ-Rfhgw 1 1 21 15 4.2mb 2.1mb
green open logstash-higher-2020-12-30 jjbYO0XBR06P74PU8T9eUw 1 1 16713 0 2.5mb 1.2mb
[root@LF-MYSQL-136-130 haha]# curl http://11.45.199.239:9200/_cat/indices?v
health status index uuid pri rep docs.count docs.deleted store.size pri.store.size
green open .apm-custom-link PlerqpqGSmubEQsz2jS7eg 1 1 0 0 416b 208b
green open .kibana_task_manager_1 _KbK1iwVQBWoTrgNszJWtg 1 1 5 333 261.3kb 156.2kb
green open .apm-agent-configuration zX030uSFSFWgzGUnNn2shA 1 1 0 0 416b 208b
green open .kibana-event-log-7.10.1-000001 8mQGHVoQRciTTwGgo7D1kQ 1 1 3 0 22.6kb 11.3kb
green open logstash-lower-2020-12-30 gsYBBGshTUyyEYce5azlJg 1 1 16722 0 2.6mb 1.3mb
green open .kibana_1 b7ujcXvlRAuAKTTQ-Rfhgw 1 1 23 0 8.4mb 4.2mb
green open logstash-higher-2020-12-30 jjbYO0XBR06P74PU8T9eUw 1 1 16722 0 2.6mb 1.3mb

若有收获,就点个赞吧
0 人点赞
