基于docker 方式部署
组件介绍:
- loki是主服务器,负责存储日志和处理查询。
- promtail是代理,负责收集日志并将其发送给 loki 。
- Grafana用于 UI 展示。
部署
loki
mkdir /etc/loki && cd /etc/lokiwget https://raw.githubusercontent.com/grafana/loki/v2.4.1/cmd/loki/loki-local-config.yaml -O loki-config.yamlmv loki-config.yaml local-config.yaml[root@k8s-node02 loki]# vim local-config.yamlhttp_listen_port: 3100grpc_listen_port: 9096common:path_prefix: /lokistorage:filesystem:chunks_directory: /loki/chunksrules_directory: /loki/rulesreplication_factor: 1ring:instance_addr: 127.0.0.1kvstore:store: inmemoryschema_config:configs:- from: 2020-10-24store: boltdb-shipperobject_store: filesystemschema: v11index:prefix: index_period: 24hruler:alertmanager_url: http://192.168.100.14:9093enable_api: truering:kvstore:store: inmemory#storage:# type: local# local:# directory: /loki/rules#flush_period: 1m创建告警规则文件mkdir -p /etc/loki/rules/fake[root@k8s-node02 fake]# cat rules.yamlgroups:- name: testlogrules:- alert: test_log_line number#expr: count_over_time({filename="/data/logs/nginx/a.log"}|="ERROR"[5s]) > 0#expr: sum by (filename) (count_over_time({job="nginxlog"}|="ERROR"[5s])) > 0expr: sum by (filename,message,host) (count_over_time({job="test-log"}|~"ERROR"|regexp "(?P<message>.*)$"[5s])) > 0for: 0labels:severity: "critical"annotations:summary: "{{ $labels.host }}"description: "{{ $labels.message }}"filename: "{{ $labels.filename }}"docker 运行docker run --name loki -v /etc/loki/local-config.yaml:/etc/loki/local-config.yaml -v /etc/loki/rules/:/loki/rules/ -d -p 3100:3100 grafana/loki:2.4.1
promtail
mkdir /etc/promtail && cd /etc/promtailwget https://raw.githubusercontent.com/grafana/loki/v2.4.1/clients/cmd/promtail/promtail-docker-config.yaml -O promtail-config.yamlmv promtail-config.yaml config.yml修改配置文件[root@k8s-node02 promtail]# cat config.ymlserver:http_listen_port: 9080grpc_listen_port: 0positions:filename: /tmp/positions.yamlclients:- url: http://192.168.100.14:3100/loki/api/v1/pushscrape_configs:- job_name: linuxstatic_configs:- targets:- localhostlabels:job: messageshost: localhost__path__: /var/log/messages*- job_name: nginxstatic_configs:- targets:- localhostlabels:job: test-loghost: k8s-node02__path__: /data/logs/nginx/*.logdocker 运行docker run --name promtail -v /etc/promtail/config.yml:/etc/promtail/config.yml -d -v /data/logs:/data/logs grafana/promtail:2.4.1
grafana
docker run -d -p 3000:3000 --name=grafana grafana/grafana:7.3.7
仪表盘配置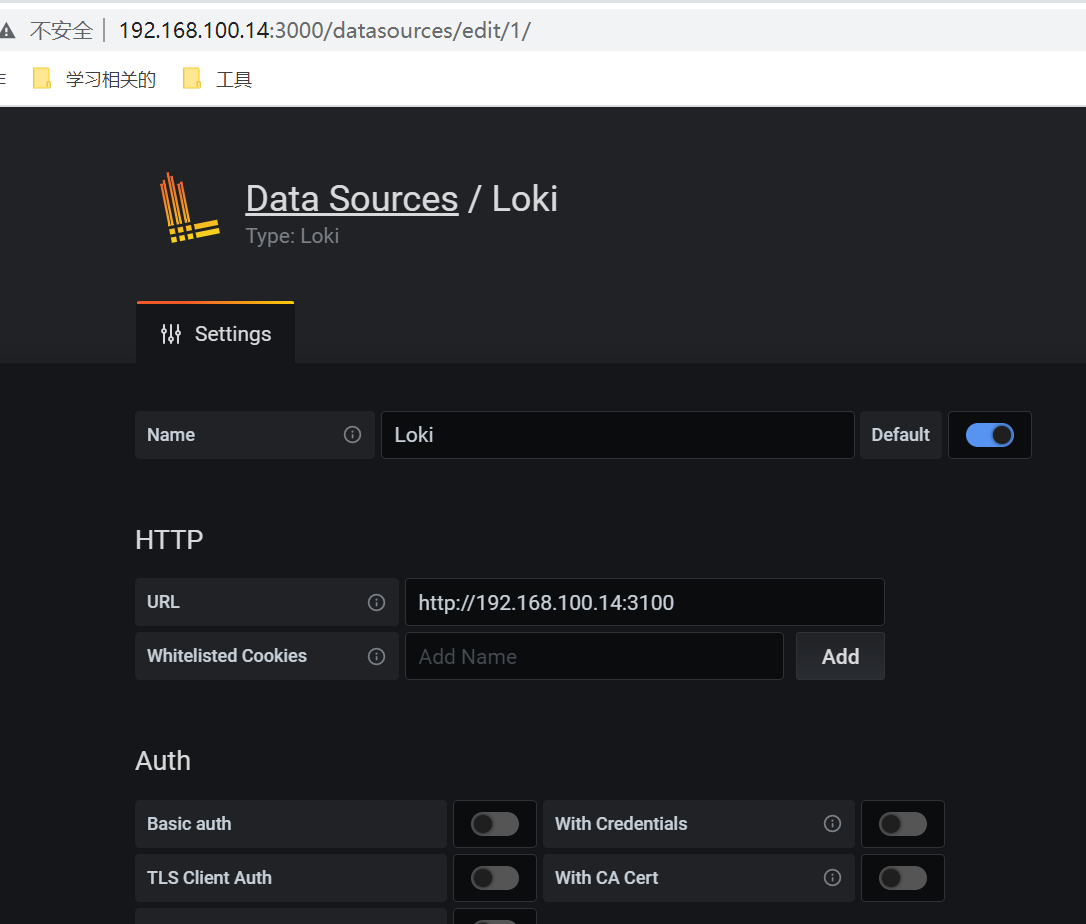
仪表盘上查看数据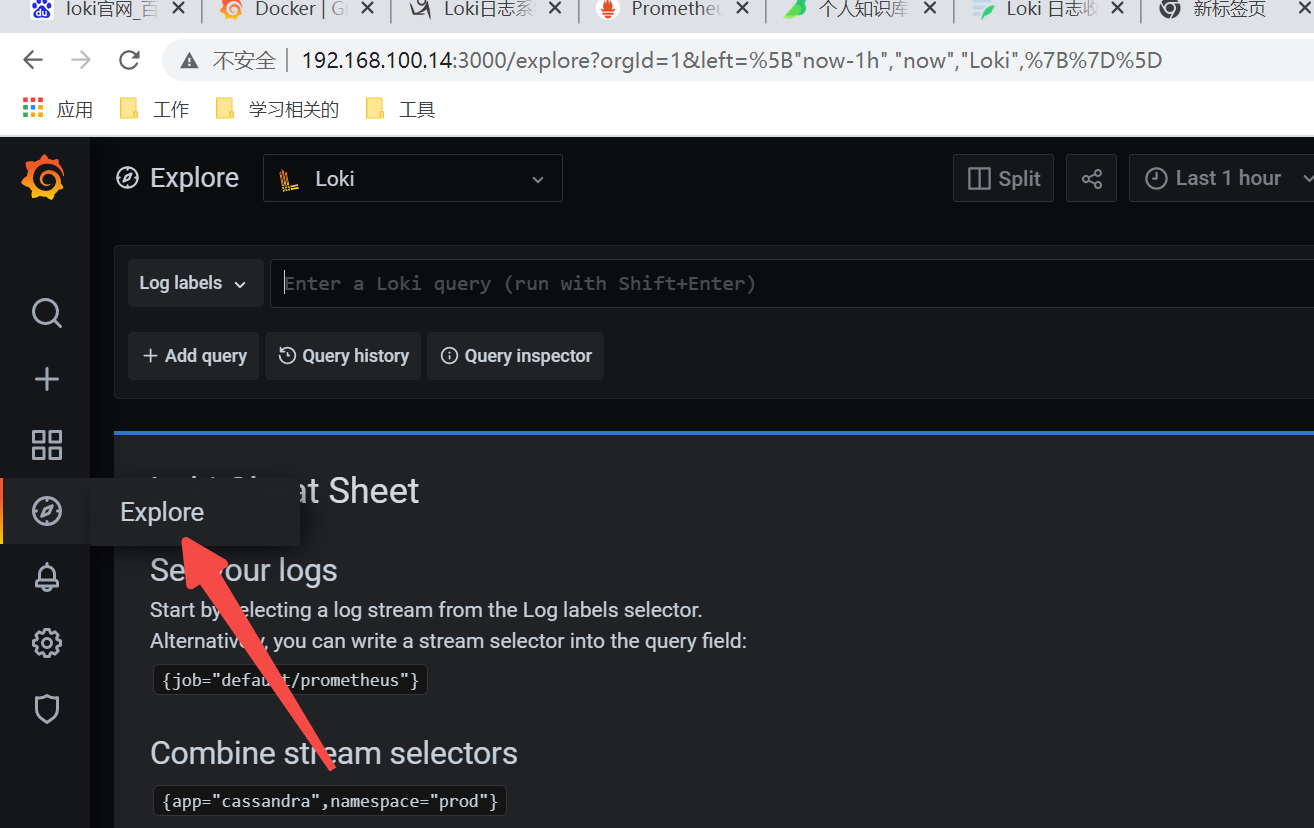
alertmanager
mkdir -p /data/monitor/alertmanager && cd /data/monitor/alertmanager[root@k8s-node02 promtail]# cat /data/monitor/alertmanager/alertmanager.ymlglobal:smtp_smarthost: 'smtp.exmail.qq.com:465'smtp_from: 'noreply@marketin.cn'smtp_auth_username: 'noreply@marketin.cn'smtp_auth_password: 'mI2bjgi5ni'resolve_timeout: 5mroute:group_by: ['alertname', 'instance']group_wait: 5sgroup_interval: 10srepeat_interval: 5mreceiver: "dingtalk"inhibit_rules:- source_match:severity: 'critical'target_match_re:severity: ^(warning)$equal: ['alertname', 'instance']receivers:- name: dingtalkwebhook_configs:- url: 'http://192.168.100.14:8060/dingtalk/webhook/send'send_resolved: true运行dockerdocker run -d -p 9093:9093 --name=alertmanager \-v /data/monitor/alertmanager/alertmanager.yml:/etc/alertmanager/alertmanager.yml \prom/alertmanager:latest
配置钉钉告警
[root@k8s-node02 prometheus-webhook-dingtalk-1.4.0.linux-amd64]# cat /root/prometheus-webhook-dingtalk-1.4.0.linux-amd64/config.yml## Request timeout# timeout: 5s## Customizable templates pathtemplates:- contrib/templates/legacy/template.tmpl## You can also override default template using `default_message`## The following example to use the 'legacy' template from v0.3.0# default_message:# title: '{{ template "legacy.title" . }}'# text: '{{ template "legacy.content" . }}'## Targets, previously was known as "profiles"targets:webhook:url: https://oapi.dingtalk.com/robot/send?access_token=67a51455f433f3dd9bfa9ee9655ca26021cd92a02258cfc82e0ff7ddca1b2bd8#message:# text: '{{ template "ding.link.content" . }}'配置发送至钉钉内容:[root@k8s-node02 prometheus-webhook-dingtalk-1.4.0.linux-amd64]# cat /root/prometheus-webhook-dingtalk-1.4.0.linux-amd64/contrib/templates/legacy/template.tmpl{{ define "ding.link.title" }}[日志报警]{{ end }}{{ define "ding.link.content" -}}{{- if gt (len .Alerts.Firing) 0 -}}{{ range $i, $alert := .Alerts.Firing }}[dangqian]:{{ index $alert.Labels "severity" }}[告警主机]:{{ index $alert.Annotations "summary"}}[日志文件]:{{ index $alert.Annotations "filename"}}[告警时间]:{{ dateInZone "2006.01.02 15:04:05" (.StartsAt) "Asia/Shanghai" }}[告警内容]:{{ index $alert.Annotations "description" }}{{ end }}{{- end }}{{- end }}

若有收获,就点个赞吧
0 人点赞
