Prometheus/MetricsServer
Prometheus
- 原型系统是BorgMon,几乎与Borg同时诞生的内部监控系统
- 工作核心是使用Pull的方式搜集被监控对象的Metrics数据,然后把数据保存在TSDB(时间序列数据库,比如OpenTSDB,InfluxDB等)以便后续可按时间进行检索

按数据来源对监控体系做一个汇总
- 宿主机的监控数据
- 需要nodeExporter以DS方式运行在宿主机上
- Exporter就是代替被监控对象来对Prometheus暴露出可以被抓取的metrics信息的辅助进程
- 包括节点的负载load、cpu、内存、磁盘、网络等
- APIServer/kubelet等组件的 /metrics API
- 各组件的核心监控指标
- 对于APIServer来说就会在 /metrics API里暴露各个Controller的工作队列长度、延迟数据等
- 检查k8s本身工作情况的重要依据
- k8s相关的核心监控数据coreMetrics
- 宿主机的监控数据
取代Heapster项目,用户可以通过标准的K8sAPI来访问这些监控数据
- http://127.0.0.1:8001/apis/metrics.k8s.io/v1beta1/namespaces/
/pods/ - 这个接口返回Pod 的监控数据,这些数据从kubelet的SummaryAPI(
: /stats/summary )采集而来的,SummaryAPI包括cAdvisor数据也包括kueblet数据 - MetricsServer不是kube-apiserver的一部分,而是通过Aggregator这种插件机制,独立部署的情况下同kube-apiserver一起统一对外服务,AggregatorAPIServer工作原理如下
- kube-aggregator其实就是根据URL选择具体API后端的代理服务器
- 方便扩展k8sAPI

- 开启Aggregator模式
—requestheader-client-ca-file=
- 开启Aggregator模式后,只需要将MetricsServer的YAML文件部署起来,部署完成后就可以在K8sAPI中看到metrics.k8s.io的 API ,如下所示```shell$ git clone https://github.com/kubernetes-incubator/metrics-server$ cd metrics-server$ kubectl create -f deploy/1.8+/
监控指标规划原则
-
USE(关注资源)
Utilization利用率,资源被有效利用起来提供服务的平均时间占比
- Saturation饱和度,资源拥挤程度,比如工作队列长度
-
RED(关注服务)
Rate每秒请求数量
- Errors每秒错误数量
-
CustomMetrics
为AutoScaling做数据支撑
- cpu、内存等资源
- 服务相关的自定义指标
- CustomMetrics+HPA(HorizontalPodAutoscaler)可以实现灵活的、可定制的扩展策略
- CustomMetrics也是借助AggregatorAPIServer扩展来实现
- 把CustomMetricsAPIServer部署并启动后,k8s里就出现了custom.metrics.k8s.io的API
- 访问这个URL时,Aggregator就会把请求转发给CustomMetricsAPIServer
- CustomMetricsAPIServer的实现就是一个Prometheus的Adaptor
- 如果要实现根据Pod收到的Http请求数量进行AutoScaling
- 要CM暴露一个URL,访问时CMAS就会去Prometheus里查询Pod的请求数量,然后按照指定格式返回
- 这个请求数量就需要Pod里的应用本身暴露出来一个/metrics API进行返回
- HPA只需要定时访问前面的URL,然后根据返回值进行计算并AutoScaling
- 编写自己的APIServer的工具库,见官方工具库 👉链接
- 实例链接
- 部署Prometheus ```shell
$ kubectl apply -f demos/monitoring/prometheus-operator.yaml clusterrole “prometheus-operator” created serviceaccount “prometheus-operator” created clusterrolebinding “prometheus-operator” created deployment “prometheus-operator” created
$ kubectl apply -f demos/monitoring/sample-prometheus-instance.yaml clusterrole “prometheus” created serviceaccount “prometheus” created clusterrolebinding “prometheus” created prometheus “sample-metrics-prom” created service “sample-metrics-prom” created
   - 部署CustomMetricsAPIServer
```shell

$ kubectl apply -f demos/monitoring/custom-metrics.yaml
namespace "custom-metrics" created
serviceaccount "custom-metrics-apiserver" created
clusterrolebinding "custom-metrics:system:auth-delegator" created
rolebinding "custom-metrics-auth-reader" created
clusterrole "custom-metrics-read" created
clusterrolebinding "custom-metrics-read" created
deployment "custom-metrics-apiserver" created
service "api" created
apiservice "v1beta1.custom-metrics.metrics.k8s.io" created
clusterrole "custom-metrics-server-resources" created
clusterrolebinding "hpa-controller-custom-metrics" created
- 为CMAS创建对应的ClusterRoleBinding,以便能够使用curl来直接访问CM的API ```shell
$ kubectl create clusterrolebinding allowall-cm —clusterrole custom-metrics-server-resources —user system:anonymous clusterrolebinding “allowall-cm” created
   - 部署待监控的应用和HPA
```shell

$ kubectl apply -f demos/monitoring/sample-metrics-app.yaml
deployment "sample-metrics-app" created
service "sample-metrics-app" created
servicemonitor "sample-metrics-app" created
horizontalpodautoscaler "sample-metrics-app-hpa" created
ingress "sample-metrics-app" created
- 观察Metrics ```shell
https://
   - 给应用加压
```shell

$ # Install hey
$ docker run -it -v /usr/local/bin:/go/bin golang:1.8 go get github.com/rakyll/hey

$ export APP_ENDPOINT=$(kubectl get svc sample-metrics-app -o template --template {{.spec.clusterIP}}); echo ${APP_ENDPOINT}
$ hey -n 50000 -c 1000 http://${APP_ENDPOINT}
- 再次观察 ```shell
$ curl -sSLk https://
<a name="l6035"></a>
# 容器日志收集与管理
- k8s对容器日志的处理方式都叫做cluster-level-logging
- 这个日志系统与容器、Pod、Node的生命周期都是完全无关的,保证了容器、Pod、Node挂了,应用日志依然可以被正常获取
- 容器中的应用把日志输出到stdout和stderr后,容器项目默认把日志输出到宿主机上的一个JSON文件,可以通过kubectl logs命令查看
- 容器中的应用也可以把日志输出到容器里的文件或其他远程存储中就属于特殊情况
- 为了实现cluster-level-logging,有四种日志方案
- 无论使用哪种日志方案都需要及时清理日志,防止磁盘被写满带来的问题
<a name="Yl34o"></a>
## loggingAgent
- Node上以DS部署loggingAgent
- loggingAgent挂载宿主机上的日志目录
- loggingAgent将日志文件转发到后端存储里保存起来
- 实例:Fluentd+远程ES [链接](https://kubernetes.io/docs/user-guide/logging/elasticsearch)(k8s的集群里默认开启logrotate,日志文件超过10M会自动rotate)
- 优点:Node上只需要一个agent,对应用和Pod没有侵入、可依赖宿主机的rsyslogd成熟的日志收集组件
- 不足:要求应用日志输出到stdout/stderr,stdout/stderr都需要dockerDaemon处理才会出现在宿主机上,所以宿主机没办法以容器为单位进行日志的rotate
- 推荐使用
<a name="4iXHG"></a>
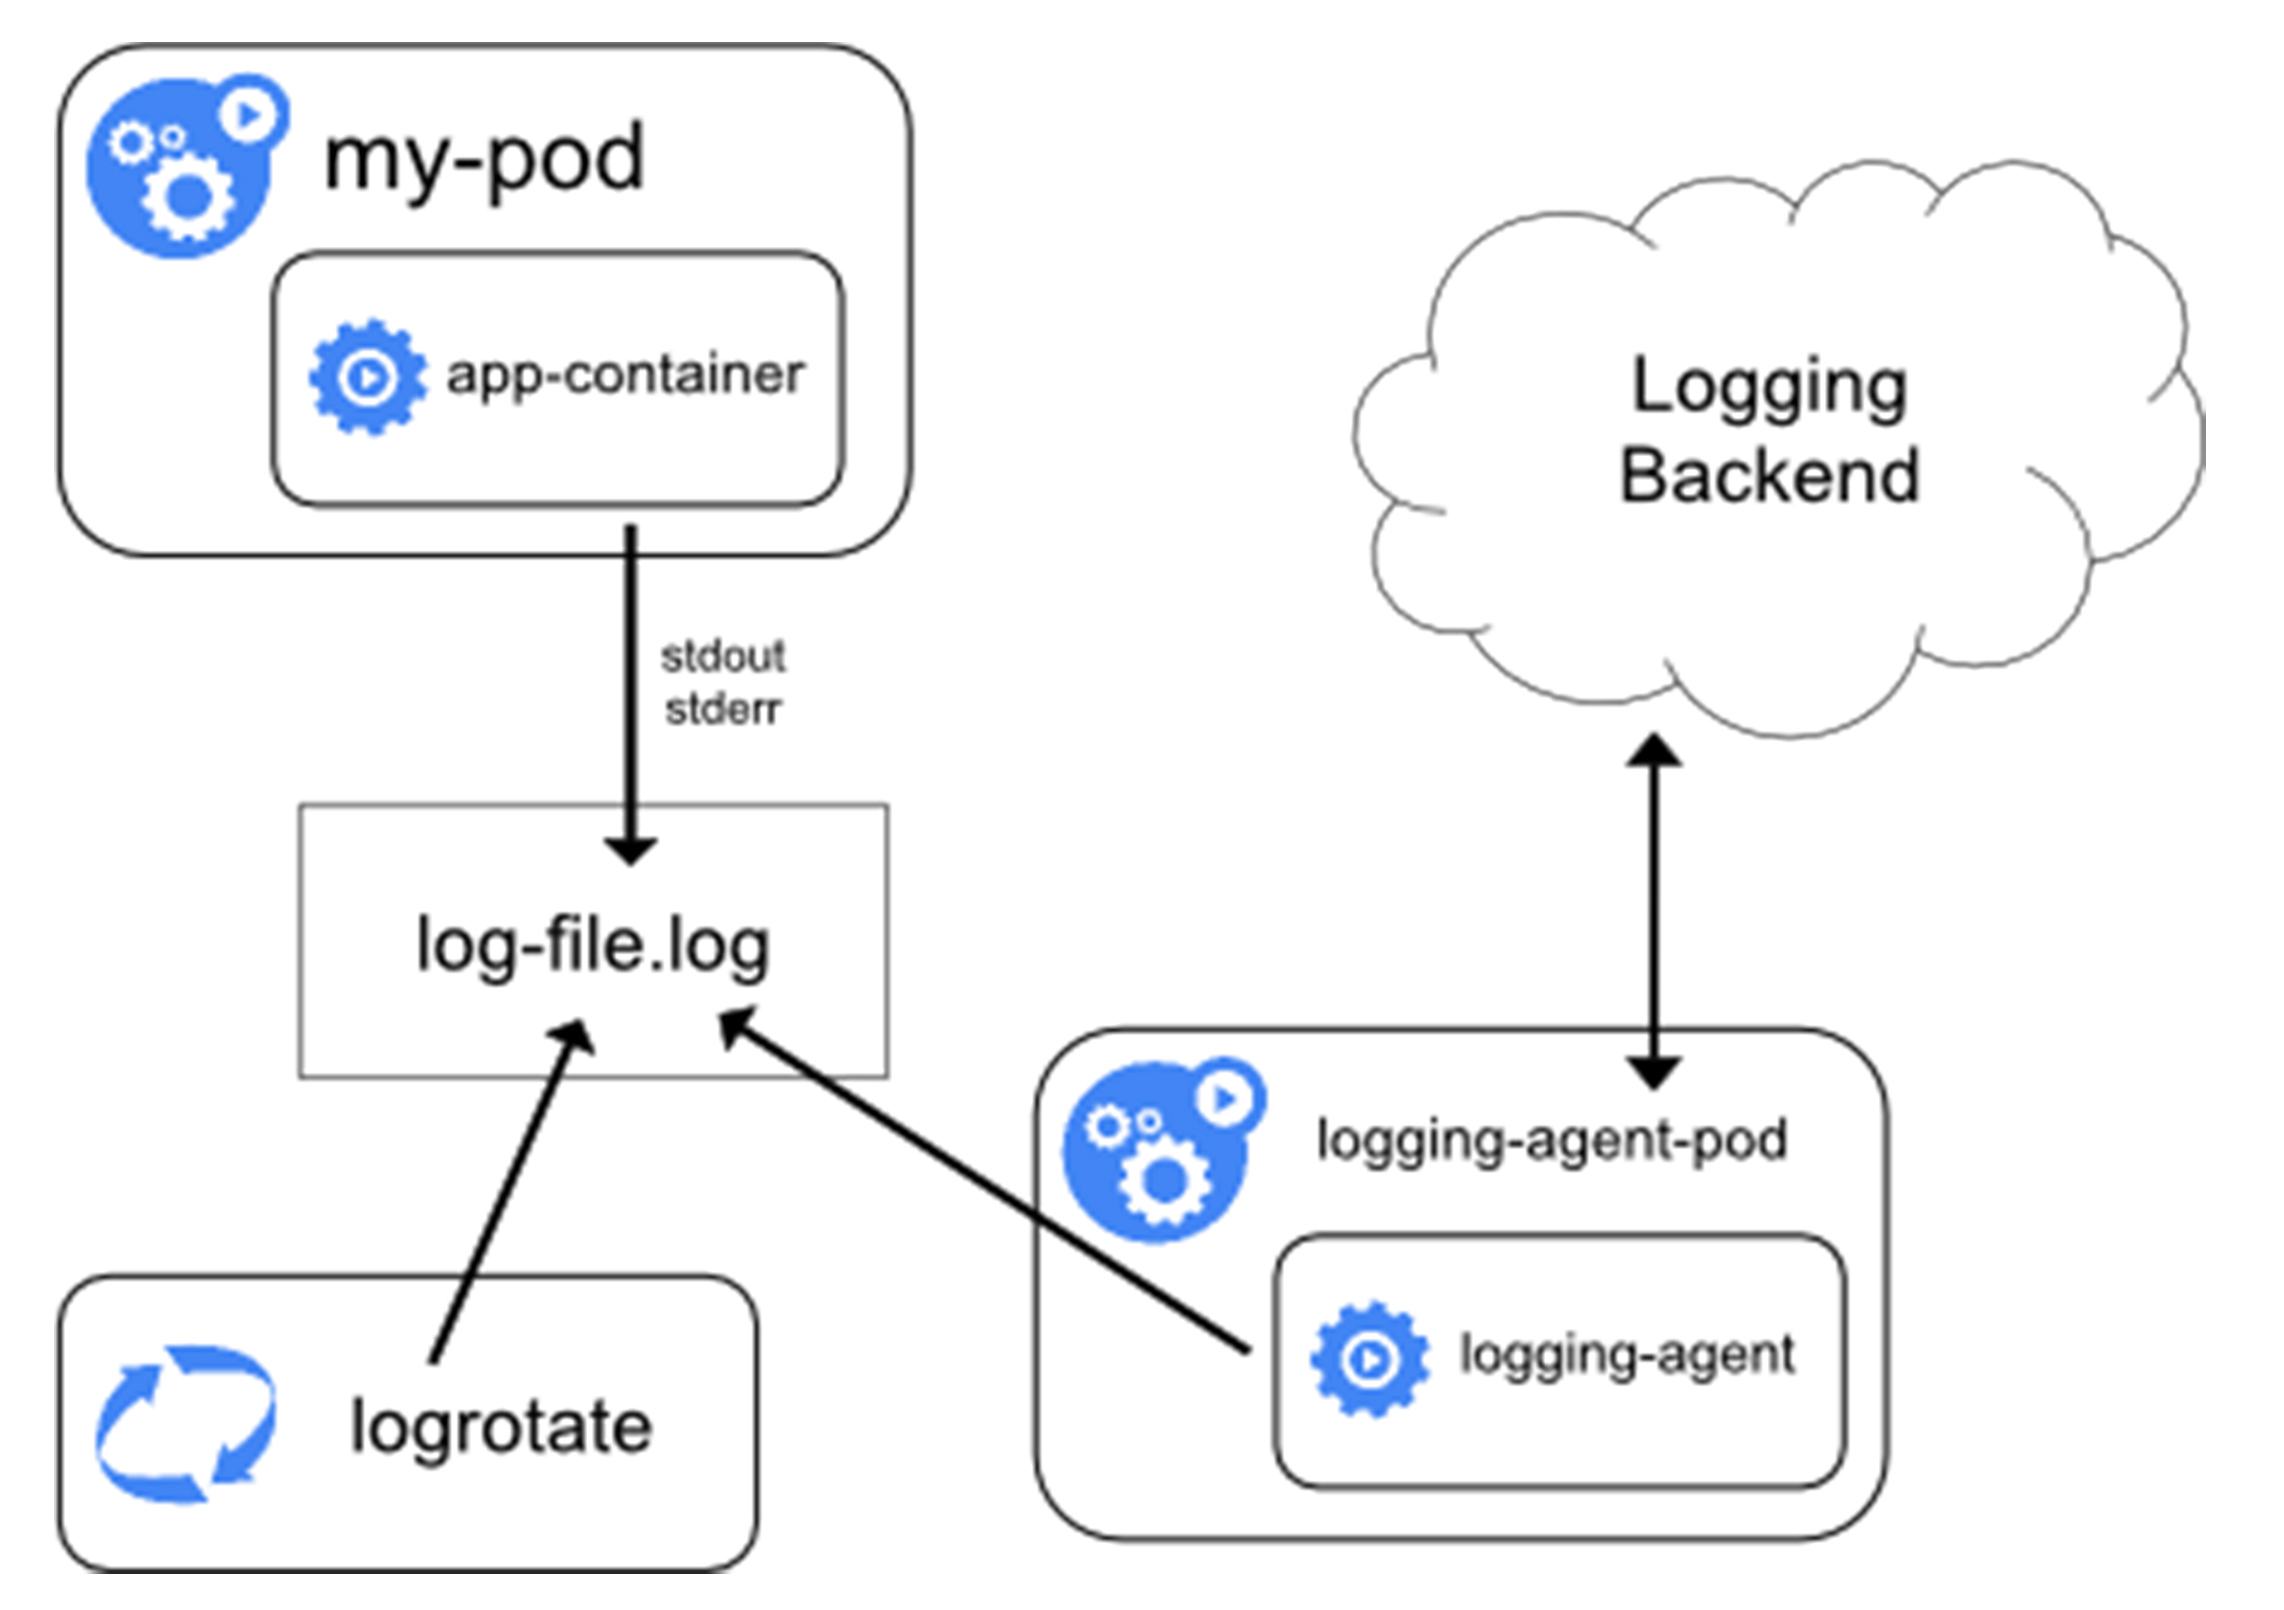
## sidecar+loggingAgent
- 当容器的日志只能输出到某些文件里的时候,可以通过一个sidecar容器把这些日志重新输出到stdout/stderr,然后使用方案一
- 如果容器把日志输出到容器里的文件,那么通过kubectl logs看不到任何日志
- 需要给Pod添加两个sidecar容器把日志文件重新以stdout/stderr的方式输出出去
- 由于和主容器共享volume,所以sidecar方案的性能损耗也不高,多用了一点CPU和内存
- 不足:宿主机上有两份日志文件(应用自己写的和sidecar导出的JSON日志文件)
- 不到万不得已不建议使用此方案
```yaml
apiVersion: v1
kind: Pod
metadata:
name: counter
spec:
containers:
- name: count
image: busybox
args:
- /bin/sh
- -c
- >
i=0;
while true;
do
echo "$i: $(date)" >> /var/log/1.log;
echo "$(date) INFO $i" >> /var/log/2.log;
i=$((i+1));
sleep 1;
done
volumeMounts:
- name: varlog
mountPath: /var/log
volumes:
- name: varlog
emptyDir: {}
---
# 添加sidecar
apiVersion: v1
kind: Pod
metadata:
name: counter
spec:
containers:
- name: count
image: busybox
args:
- /bin/sh
- -c
- >
i=0;
while true;
do
echo "$i: $(date)" >> /var/log/1.log;
echo "$(date) INFO $i" >> /var/log/2.log;
i=$((i+1));
sleep 1;
done
volumeMounts:
- name: varlog
mountPath: /var/log
- name: count-log-1
image: busybox
args: [/bin/sh, -c, 'tail -n+1 -f /var/log/1.log']
volumeMounts:
- name: varlog
mountPath: /var/log
- name: count-log-2
image: busybox
args: [/bin/sh, -c, 'tail -n+1 -f /var/log/2.log']
volumeMounts:
- name: varlog
mountPath: /var/log
volumes:
- name: varlog
emptyDir: {}
$ kubectl logs counter count-log-1
0: Mon Jan 1 00:00:00 UTC 2001
1: Mon Jan 1 00:00:01 UTC 2001
2: Mon Jan 1 00:00:02 UTC 2001
...
$ kubectl logs counter count-log-2
Mon Jan 1 00:00:00 UTC 2001 INFO 0
Mon Jan 1 00:00:01 UTC 2001 INFO 1
Mon Jan 1 00:00:02 UTC 2001 INFO 2
...
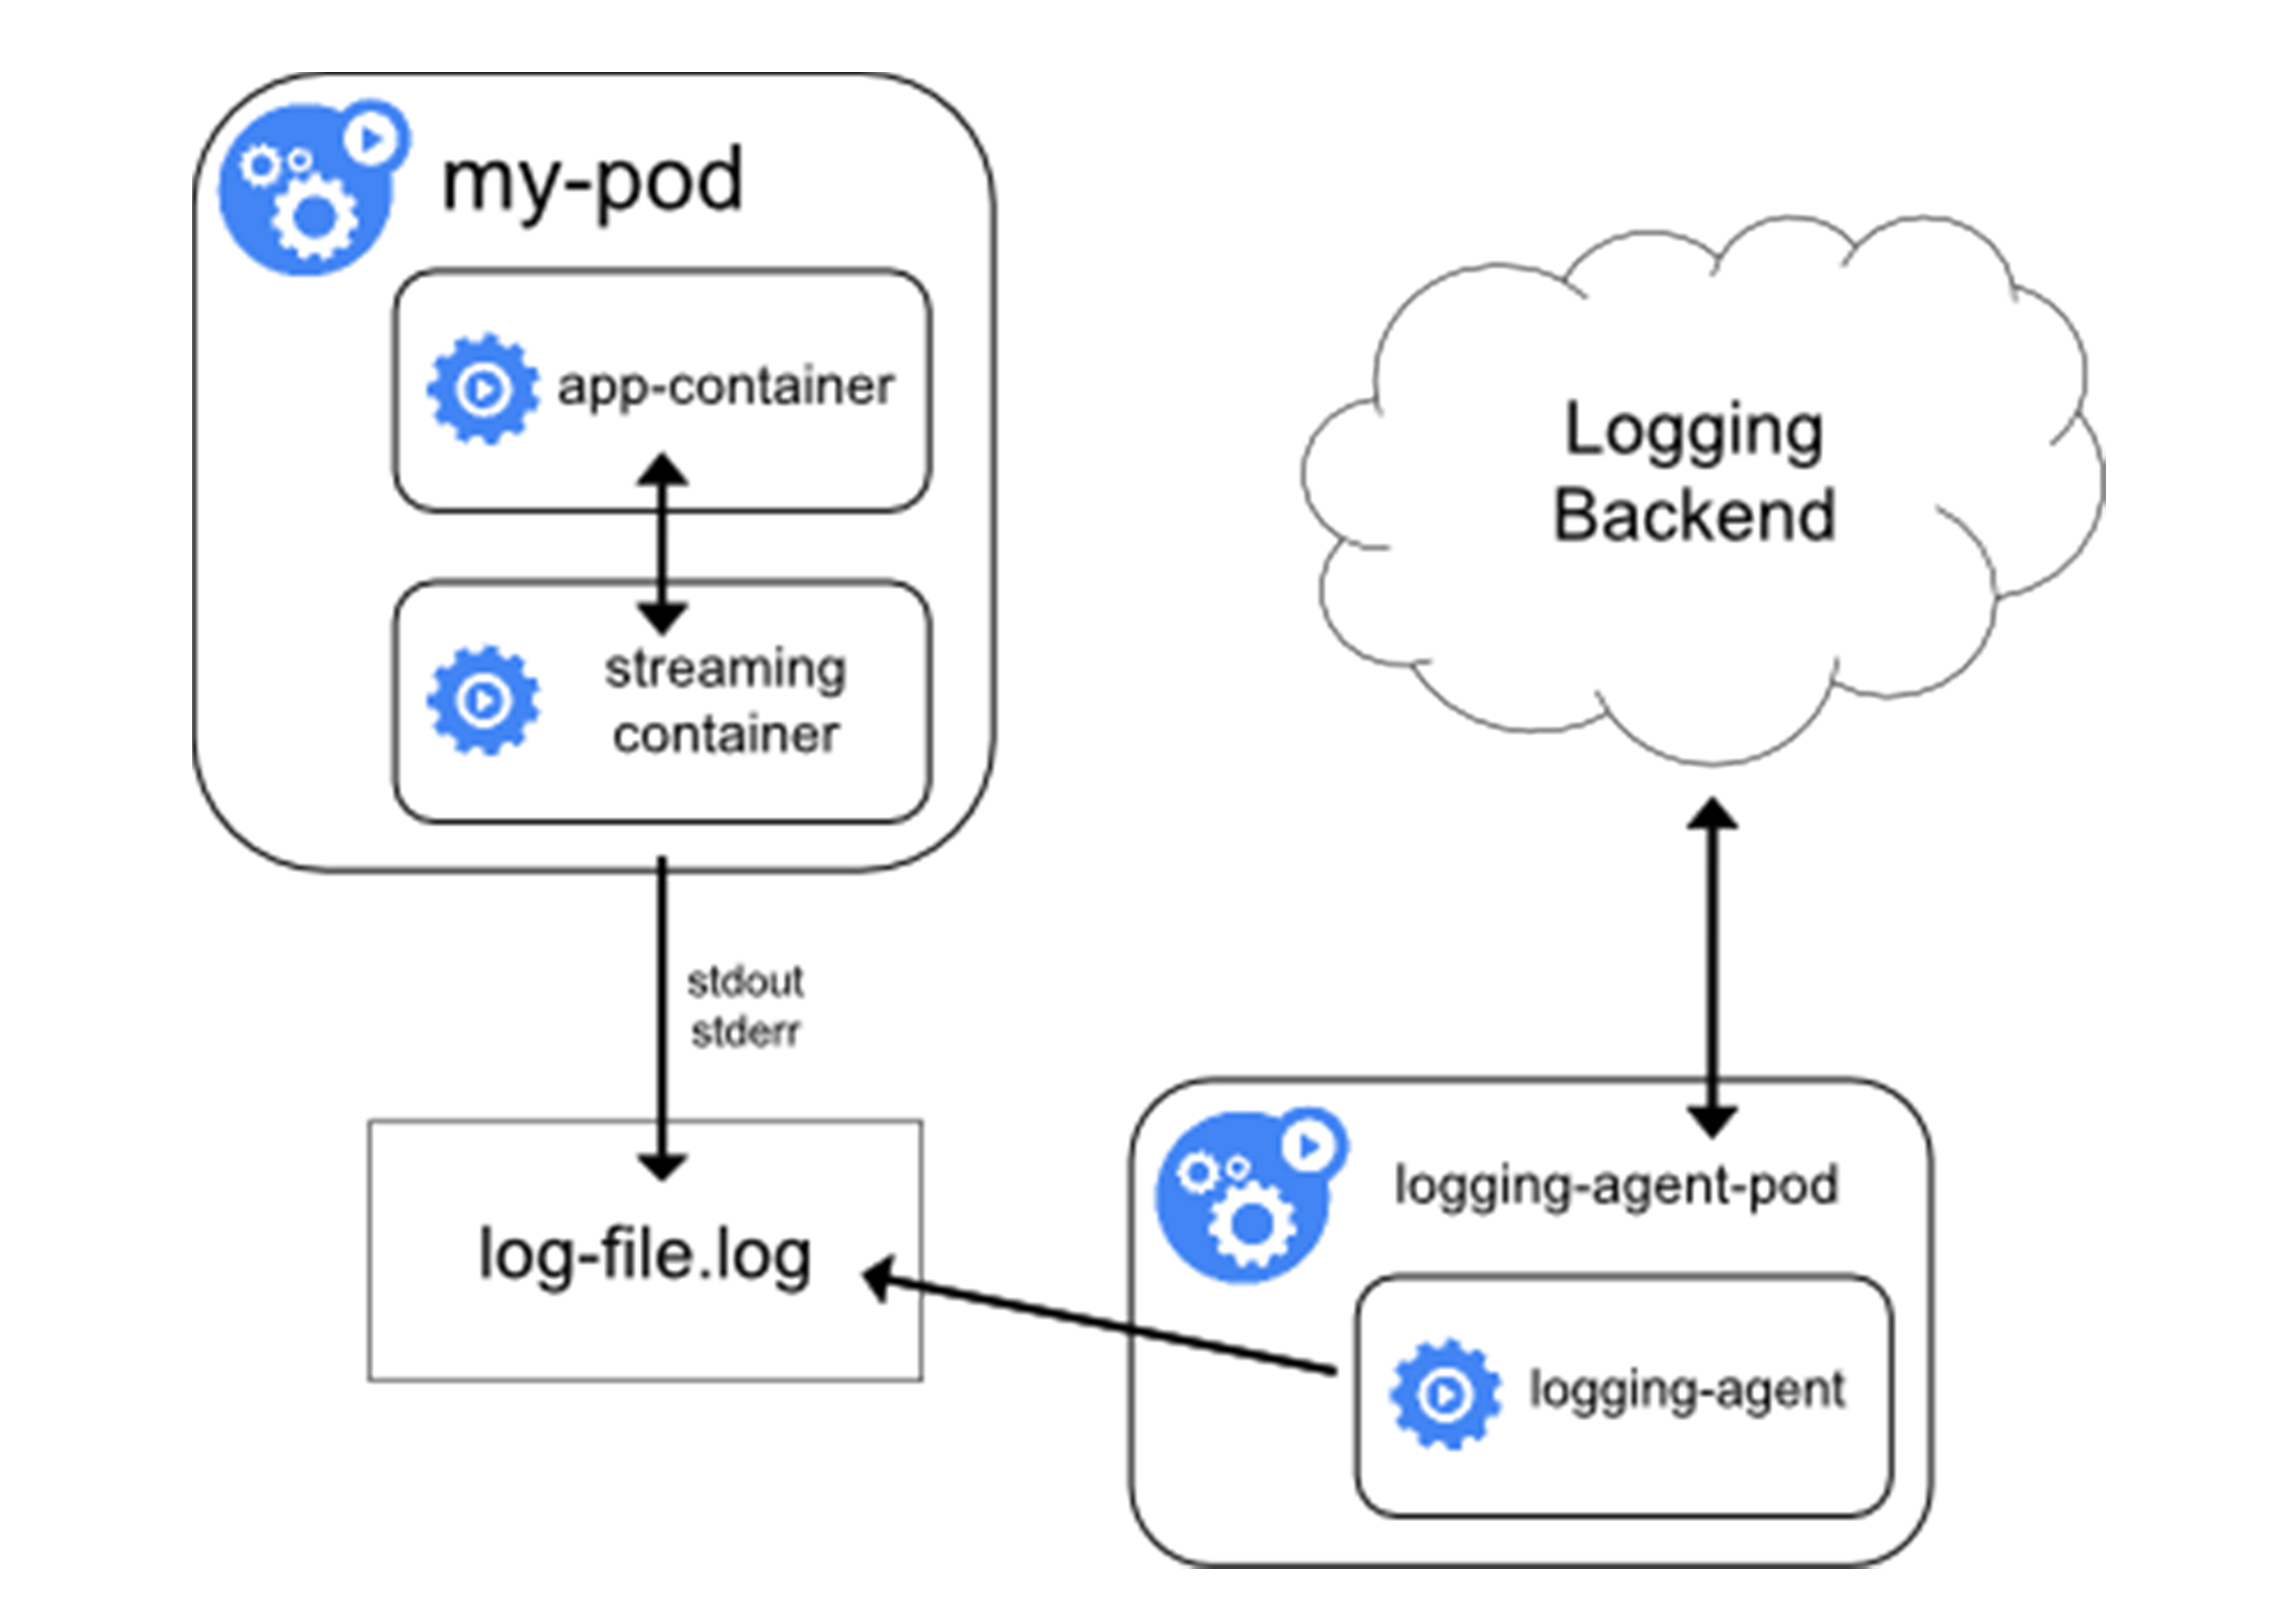
sidecar
- 直接用一个sidecar容器把应用的日志文件发送到远程存储
- 即把方案一的loggingAgent直接放到了Pod里
- 应用还是可以把日志输出到固定文件,loggingAgent还可以使用fluentd,远程存储还可以是ES
- 一般会把fluentd 的输入源配置保存在CM里,然后应用Pod的定义里就可以声明一个fluentd容器作为sidecar,专门负责将应用生成的日志转发到ES
- 优点:部署简单
- 不足:sidecar容器可能会消耗比较多的资源,甚至拖垮应用容器,日志还是不能通过kubectl logs获取
apiVersion: v1
kind: ConfigMap
metadata:
  name: fluentd-config
data:
  fluentd.conf: |
    <source>
      type tail
      format none
      path /var/log/1.log
      pos_file /var/log/1.log.pos
      tag count.format1
    </source>

    <source>
      type tail
      format none
      path /var/log/2.log
      pos_file /var/log/2.log.pos
      tag count.format2
    </source>

    <match **>
      type google_cloud
    </match>
apiVersion: v1
kind: Pod
metadata:
  name: counter
spec:
  containers:
  - name: count
    image: busybox
    args:
    - /bin/sh
    - -c
    - >
      i=0;
      while true;
      do
        echo "$i: $(date)" >> /var/log/1.log;
        echo "$(date) INFO $i" >> /var/log/2.log;
        i=$((i+1));
        sleep 1;
      done
    volumeMounts:
    - name: varlog
      mountPath: /var/log
  - name: count-agent
    image: k8s.gcr.io/fluentd-gcp:1.30
    env:
    - name: FLUENTD_ARGS
      value: -c /etc/fluentd-config/fluentd.conf
    volumeMounts:
    - name: varlog
      mountPath: /var/log
    - name: config-volume
      mountPath: /etc/fluentd-config
  volumes:
  - name: varlog
    emptyDir: {}
  - name: config-volume
    configMap:
      name: fluentd-config
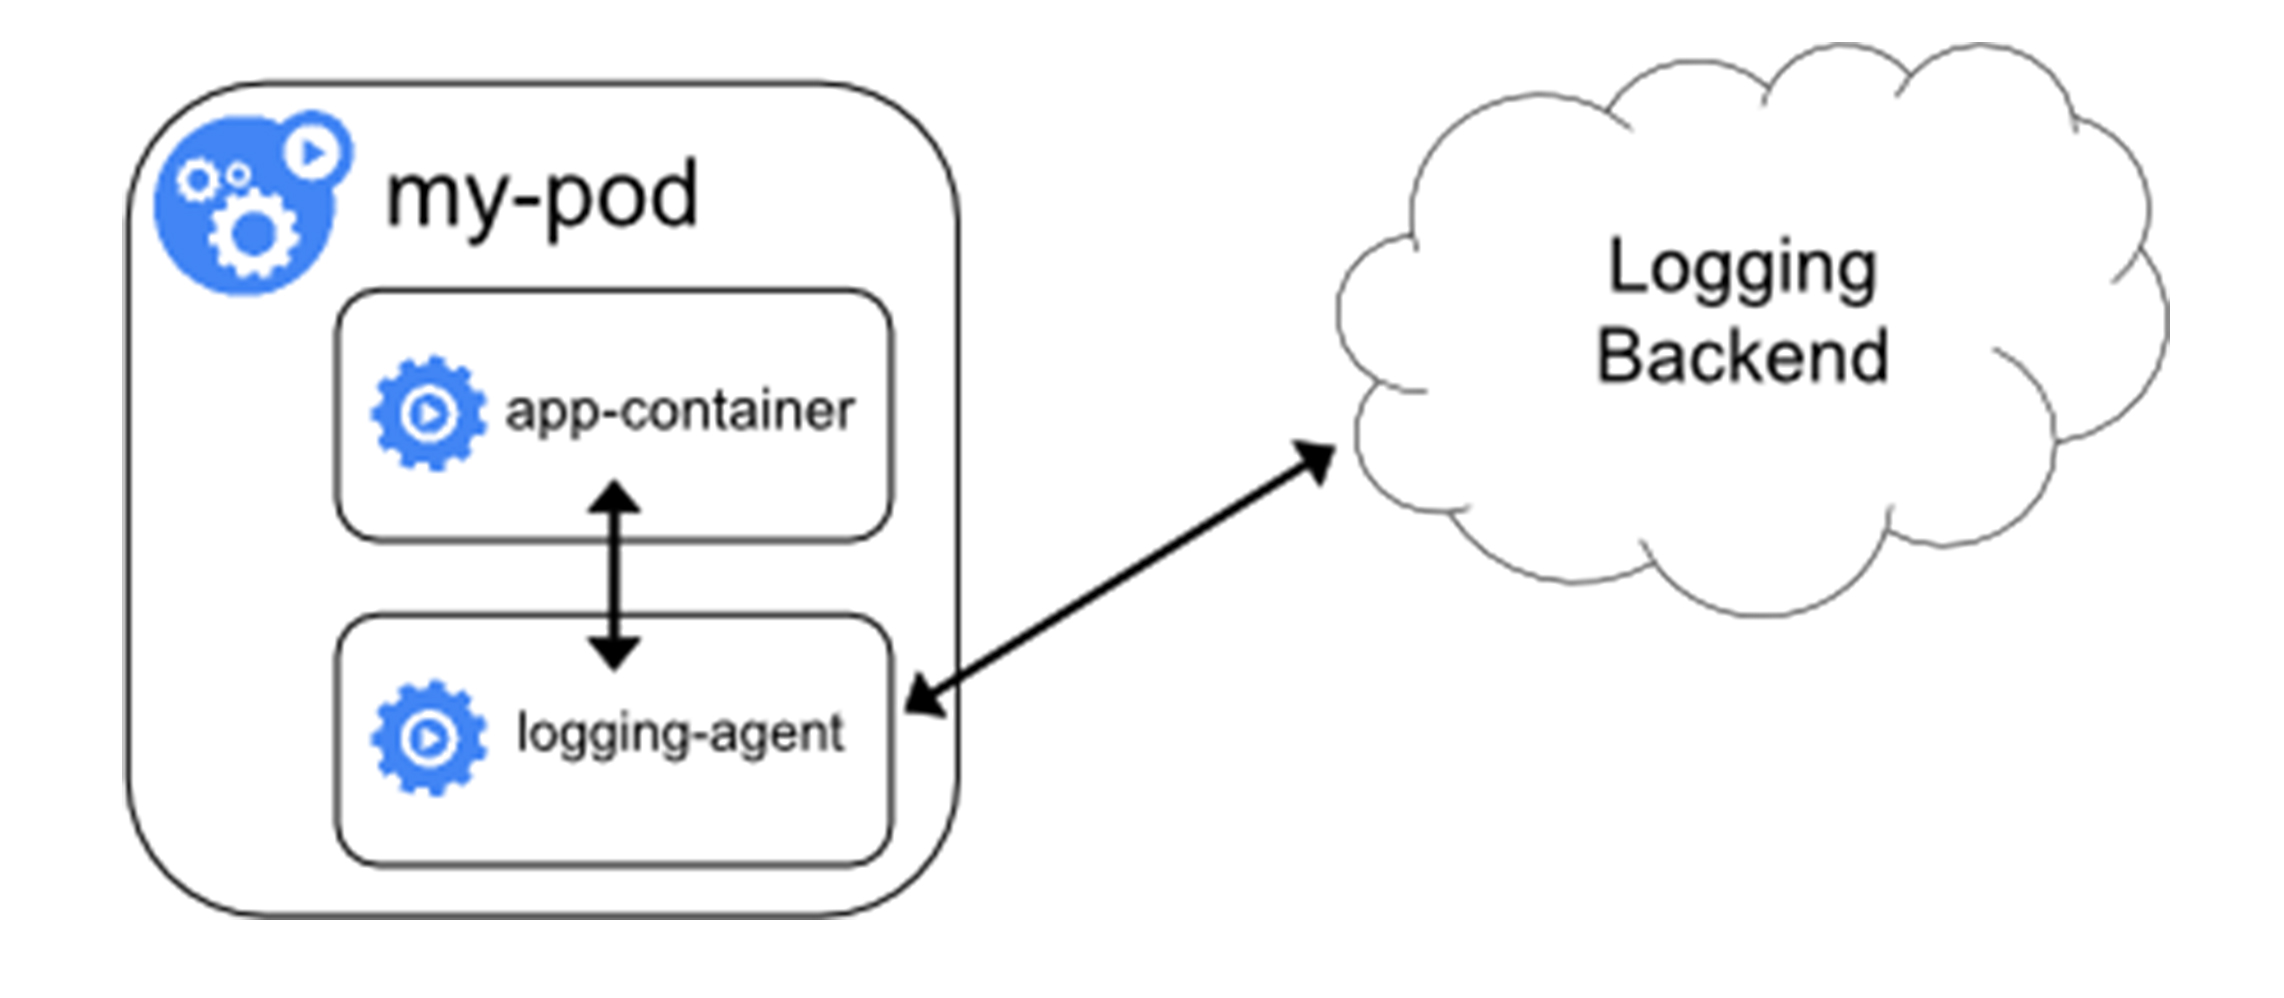
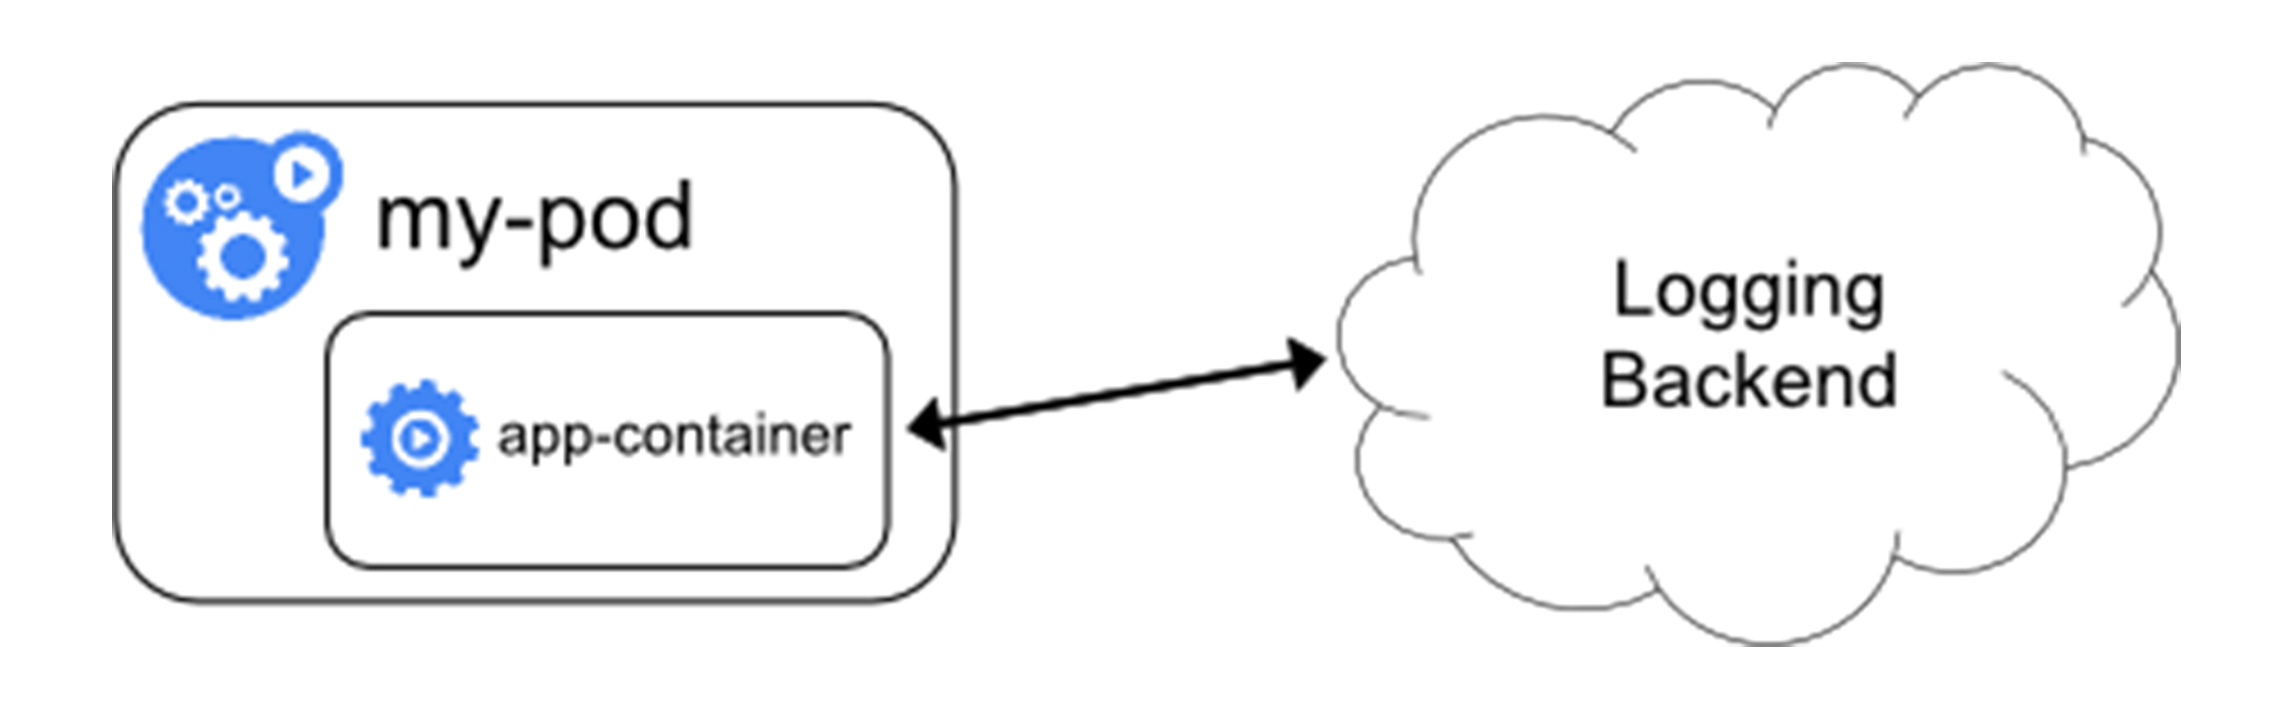
直接存储
- 编写应用的时候,直接指定好日志的存储后端
- k8s完全不必操心日志收集,对于本身已经有完善的日志处理系统公司来说是一个好的选择

若有收获,就点个赞吧
0 人点赞
