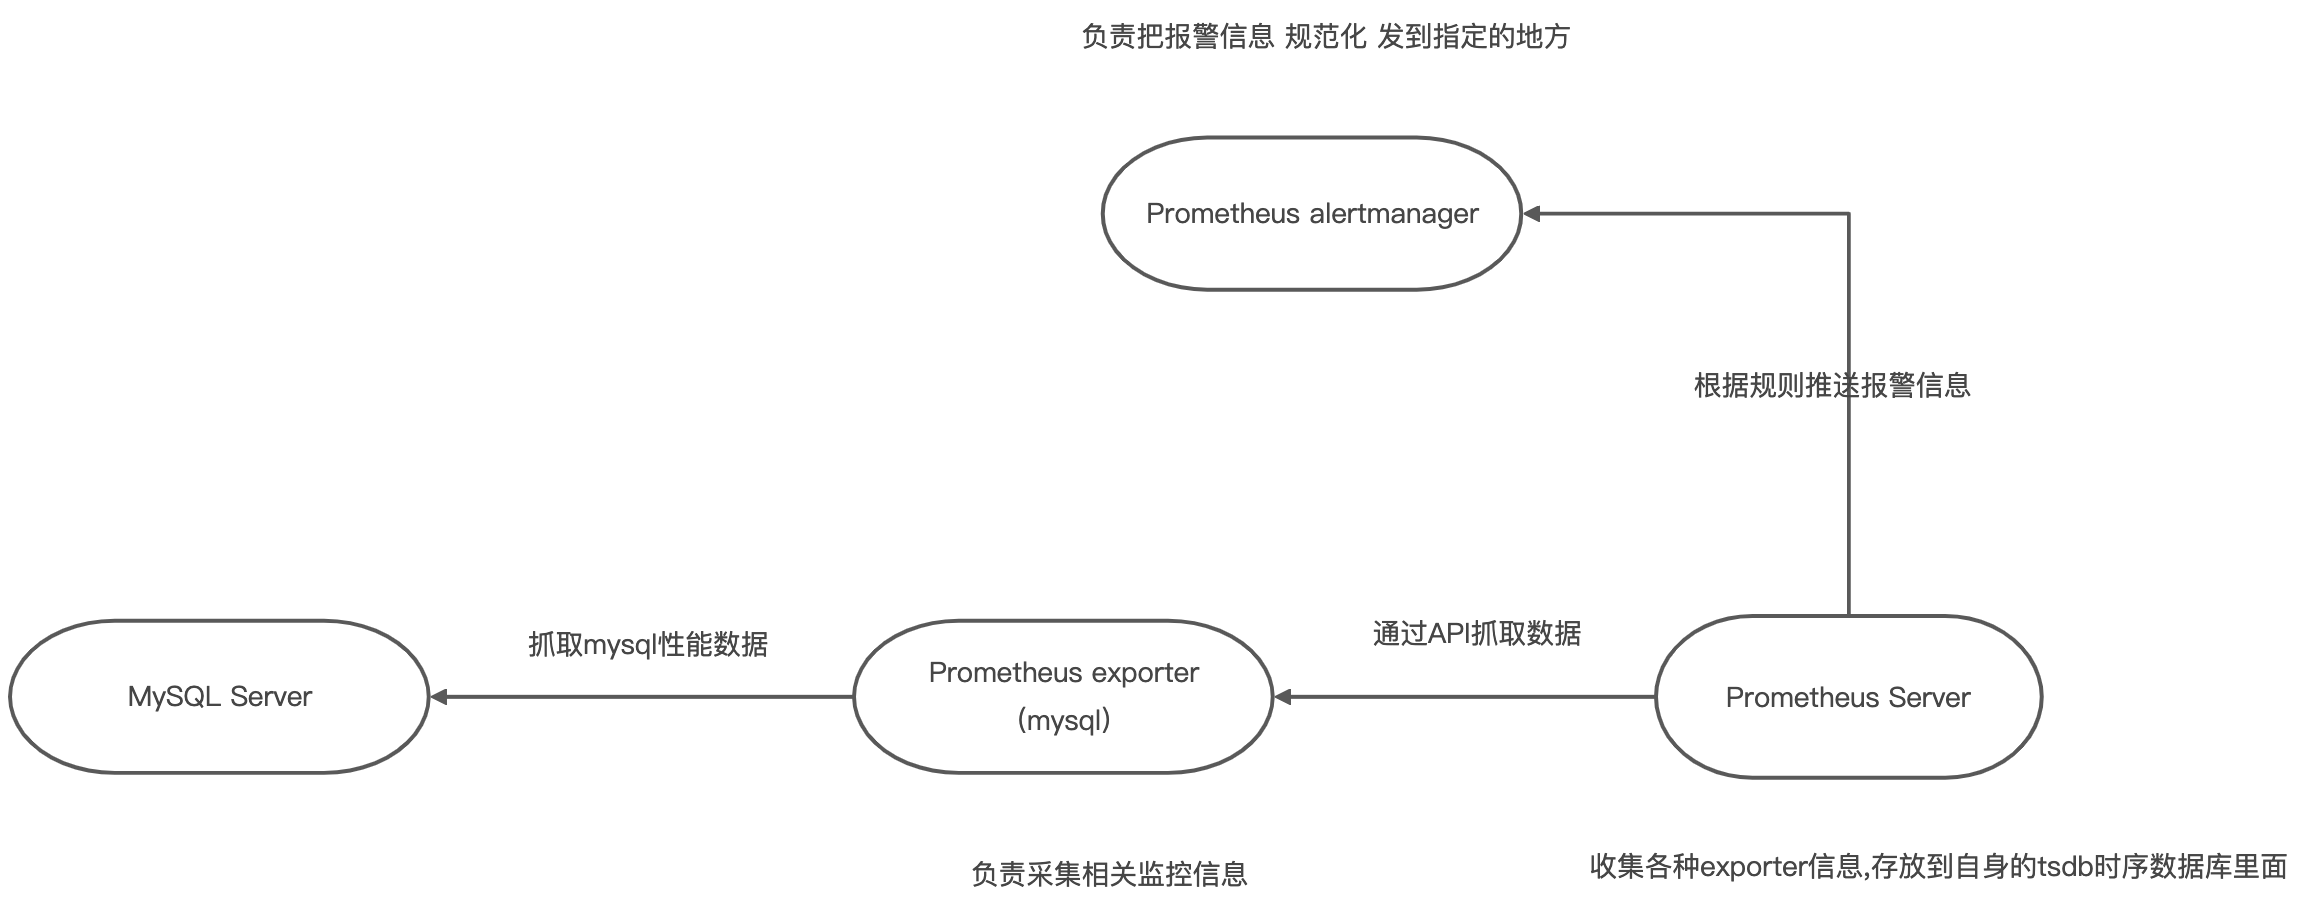
原理
安装 (以linux为例)
下载地址:https://prometheus.io/download/
安装Prometheus (可放在自建文件夹,也可放在opt)
## 下载wget https://github.com/prometheus/prometheus/releases/download/v2.18.1/prometheus-2.18.1.linux-amd64.tar.gz## 解压tar xvfz prometheus-2.18.1.linux-amd64.tar.gz## 进入解压的目录cd prometheus-2.7.2.linux-amd64:## 运行./prometheus --config.file=prometheus.yml
示例:IP+9090 直接在自己电脑中访问 如果访问不了,请检查防火墙配置 如果出现可视化界面说明成功
安装node_exporter (监控服务器CPU.硬盘,网络等状态)
## 下载 (rc 为测试版)wget https://github.com/prometheus/node_exporter/releases/download/v1.0.0-rc.1/node_exporter-1.0.0-rc.1.linux-amd64.tar.gz## 解压tar xvfz node_exporter-1.0.0-rc.1.linux-amd64.tar.gz## 进入解压的目录cd node_exporter-1.0.0-rc.1.linux-amd64## 运行./node_exporter
安装alertmanager (报警处理 官方不支持阿里云短信)
## 下载wget https://github.com/prometheus/alertmanager/releases/download/v0.20.0/alertmanager-0.20.0.linux-amd64.tar.gz## 解压tar xvfz alertmanager-0.20.0.linux-amd64.tar.gz## 进入解压的目录cd alertmanager-0.20.0.linux-amd64## 运行./alertmanager --log.level=debug
安装mysqld_exporter (mysql 收集器)
## 下载wget https://github.com/prometheus/mysqld_exporter/releases/download/v0.12.1/mysqld_exporter-0.12.1.linux-amd64.tar.gz## 解压tar xvfz mysqld_exporter-0.12.1.linux-amd64.tar.gz## 进入解压的目录cd mysqld_exporter-0.12.1.linux-amd64## 配置临时环境 用户名 密码 IP 端口export DATA_SOURCE_NAME='exporter:123456@(192.168.15.167:3306)/'## 运行./mysqld_exporter
安装redis_exporter (redis收集器)
## 下载wget https://github.com/oliver006/redis_exporter/releases/download/v1.6.1/redis_exporter-v1.6.1.linux-amd64.tar.gz## 解压tar xvfz redis_exporter-v1.6.1.linux-amd64.tar.gz## 进入到解压目录cd redis_exporter-v1.6.1.linux-amd64## 运行 后加redis IP./redis_exporter -redis.addr=192.168.15.167 -redis.password=123456
安装mongodb_exporter (mongo收集器)
## 下载wget https://github.com/percona/mongodb_exporter/releases/download/v0.11.0/mongodb_exporter-0.11.0.linux-amd64.tar.gz## 解压tar xvfz mongodb_exporter-0.11.0.linux-amd64.tar.gz## 进入到解压目录cd mongodb_exporter-0.11.0.linux-amd64## 单机 临时环境配置 IP 端口 用户名 密码export MONGODB_URI='mongodb://192.168.15.167:27017'export HTTP_AUTH='admin:123456'## 集群export MONGODB_URI=mongodb://mongodb_exporter:s3cr3tpassw0rd@localhost:10011ca## 运行./mongodb_exporter
配置
安装配置
# Prometheus 全局配置global:scrape_interval: 60s # 设定抓取数据的周期,默认为1minevaluation_interval: 60s # 设定更新rules文件的周期,默认为1min# scrape_timeout is set to the global default (10s).# Alertmanager配置alerting:alertmanagers:- static_configs:- targets: ['localhost:9093'] #设定alertmanager和prometheus交互的接口,即alertmanager监听的ip地址和端口# rule配置,首次读取默认加载,之后根据evaluation_interval设定的周期加载rule_files:# - "first_rules.yml"# - "second_rules.yml"- "rules.yml"# scape配置scrape_configs:# job_name默认写入timeseries的labels中,可以用于查询使用- job_name: 'node'scrape_interval: 1s # 抓取周期,默认采用global配置static_configs: # 静态配置- targets: ['localhost:9100'] # prometheus所要抓取数据的地址,即instance实例项labels:group: 'nodes'- job_name: 'mysql'scrape_interval: 1s # 抓取周期,默认采用global配置static_configs: # 静态配置- targets: ['localhost:9104'] # prometheus所要抓取数据的地址,即instance实例项- job_name: 'redis'scrape_interval: 15sstatic_configs:- targets: ['localhost:9121']- job_name: 'mongodb'scrape_interval: 15sstatic_configs:- targets: ['192.168.10.69:9216']basic_auth: ## 需要配置mongdb 的用户名密码username: adminpassword: 123456
报警规则配置
groups:- name: node ## node_exporter监控报警rules:- alert: server_status # 告警名称expr: up{group="nodes"} == 0 # 告警的判定条件,参考Prometheus高级查询来设定for: 15s # 满足告警条件持续时间多久后,才会发送告警annotations: # 解析项,详细解释告警信息summary: "机器 {{ $labels.instance }} 挂了"labels:serverity: warning- name: mysql ## mysql 监控报警rules:- alert: mysql_server_statusexpr: mysql_up{job="mysql"} == 0for: 10sannotations:summary: "Instance {{ $labels.instance }} MySQL is down"description: "MySQL database is down. This requires immediate action!"groups:- name: noderules:- alert: server_statusexpr: up{group="nodes"} == 0for: 15slabels:severity: warningannotations:summary: "机器 {{ $labels.instance }} 挂了"- name: mysqlrules:- alert: mysql_server_statusexpr: mysql_up{job="mysql"} == 0for: 10sannotations:summary: "Instance {{ $labels.instance }} MySQL is down"description: "MySQL database is down. This requires immediate action!"- name: mysql_qpsrules:- alert: mysql_high_QPSexpr: rate(mysql_global_status_questions{job="mysql"}[5m]) > 500for: 10sannotations:summary: "{{ $labels.instance }}: Mysql_High_QPS detected"description: "{{ $labels.instance }}: Mysql操作速度超过每秒500次,(当前值:{{$value}})"- name: mysql_connectionsrules:- alert: MySQL_Number_of_Connectionsexpr: mysql_global_status_max_used_connections{job="mysql"} > 300for: 10sannotations:summary: "{{ $labels.instance }}: Mysql_number_of_Connections"description: "{{ $labels.instance }}: 当前连接数大于300"- name: mysql_slowrules:- alert: MySQL_slow_queriesexpr: rate(mysql_global_status_slow_queries{job="mysql"}[5m]) > 3for: 10sannotations:summary: "{{ $labels.instance }}: Mysql_slow_queries"description: "{{ $labels.instance }}: Mysql slow_queries is more than 3 per second ,(current value is: {{ $value }})"- name: mysql_innodb_bufferrules:- alert: MySQL_inodb_bufferexpr: (1 - mysql_global_status_innodb_buffer_pool_reads{job="mysql"} / mysql_global_status_innodb_buffer_pool_read_requests{job="mysql"}) * 100 > 95for: 10sannotations:summary: "{{ $labels.instance }}: global_status_innodb_buffer_pool"description: "{{ $labels.instance }}: 当前innodb存储引擎缓冲池命中率大于95%"- name: mysql_behindrules:- alert: Mysql_behind_masterexpr: mysql_slave_status_seconds_behind_master{job="mysql"} > 60for: 10sannotations:summary: "{{ $labels.instance }}: Mysql_Behind_Master"description: "{{ $labels.instance }}: 主从延迟大于60s"- name: redisrules:- alert: Redis_CPUexpr: redis_cpu_sys_seconds_total{job="redis"} + redis_cpu_user_seconds_total{job="redis"} > 80for: 10sannotations:summary: "{{ $labels.instance }}: Redis_CPU"description: "{{ $labels.instance }}: Redis CPU使用率大于80%"- name: redis_connectionUsagerules:- alert: Redis_ConnectionUsageexpr: redis_connections_received_total{job="redis"}/100 > 80for: 10sannotations:summary: "{{ $labels.instance }}: Redis_ConnectionUsage"description: "{{ $labels.instance }}: 接树使用率大于80%"- name: redis_uprules:- alert: Redis_upexpr: redis_up{job="redis"} == 0for: 10sannotations:summary: "Instance {{ $labels.instance }} MySQL is down"description: "{{ $labels.instance }}: redis 挂了"- name: mongodbrules:- alert: MongoDB_connections_numberexpr: mongodb_connections_metrics_created_total{job="mongodb"} > 200for: 10sannotations:summary: "{{ $labels.instance }} MongoDB_connections_number"description: "{{ $labels.instance }}: 当前连接数大于200"
alertmanager 配置
global:resolve_timeout: 5m # 处理超时时间wechat_api_corp_id: 'wwf19fbf8843e4e994' # 企业信息(我的企业-->CorpId[在底部])wechat_api_secret: '4k_lpyXAne3i4jUQT3jX1y1r1G2KOokd7U5eyMwOLs0' # 企业微信(企业微信-->自定应用-->Secret)templates:- 'template/*.tmpl' # 定义模板# 定义路由信息route:group_by: ['alertname'] # 报警分组依据group_wait: 1s # 最初即第一次等待多久时间发送一组警报的通group_interval: 5m # 在发送新警报前的等待时间repeat_interval: 60m # 发送重复警报的周期 对于email配置中,此项不可以设置过低,否则将会由于邮件发送太多频繁,被smtp服务器拒绝receiver: 'wechat' # 发送警报的接收者的名称,以下receivers name的名称# 接受者receivers:- name: 'wechat' # 警报wechat_configs: # 企业微信报警配置- send_resolved: trueto_party: '1' # 接收组的idagent_id: '1000003' # (企业微信-->自定应用-->AgentId)corp_id: 'wwf19fbf8843e4e994' # 企业信息(我的企业-->CorpId[在底部])api_secret: '4k_lpyXAne3i4jUQT3jX1y1r1G2KOokd7U5eyMwOLs0' # 企业微信(企业微信-->自定应用-->Secret)## 这个叫做抑制项,通过匹配源告警来抑制目的告警。比如说当我们的主机挂了,可能引起主机上的服务,数据库,中间件等一些告警,假如说后续的这些告警相对来说没有意义,我们可以用抑制项这个功能,让PrometheUS只发出主机挂了的告警。inhibit_rules:- source_match: ## # 当此告警发生,其他的告警被抑制severity: 'critical'target_match: ## # 被抑制的对象severity: 'warning'## 此处的集合的label,在源和目的里的值必须相等。如果该集合的内的值再源和目的里都没有,那么目的告警也会被抑制。equal: ['id', 'instance']
报警模板配置
{{ define "wechat.default.message" }}{{ range .Alerts }}========start=========告警程序: prometheus_alert告警级别: {{ .Labels.serverity }}告警类型: {{ .Labels.alertname }}故障主机: {{ .Labels.instance }}告警主题: {{ .Annotations.summary }}告警详情: {{ .Annotations.description }}触发时间: {{ .StartsAt.Format "2006-01-02 15:04:05" }}=========end==========={{ end }}{{ end }}
mysqld_exporter 配置
## 从docker进入到mysql服务$ docker exec -it e009208d7844 /bin/bash## 创建建用户信息$ GRANT REPLICATION CLIENT, PROCESS ON . to 'exporter'@'%' identified by '8Wua5uNbIY9E';$ GRANT SELECT ON performance_schema.* TO 'exporter'@'%';$ flush privileges;
mongodb_export 配置
# 进入mongo$ mongo --port 10011## 使用 admin$ use admin## 登录 admin$ db.auth('root','123456')## 创建集群账户(集群的时候需要这个)$ db.getSiblingDB("admin").createUser({user: "mongodb_exporter",pwd: "s3cr3tpassw0rd",roles: [{ role: "clusterMonitor", db: "admin" },{ role: "read", db: "local" }]})
验证
验证node_exporter 只要node一掉线 就会报警(走rules里面的node监控报警)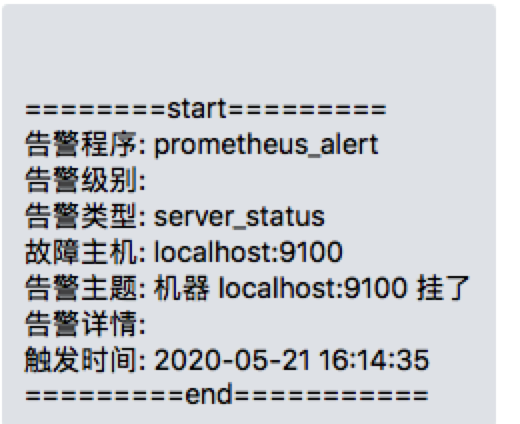
验证mysql 只要mysql服务一挂 就会产生 报警 通知到企业微信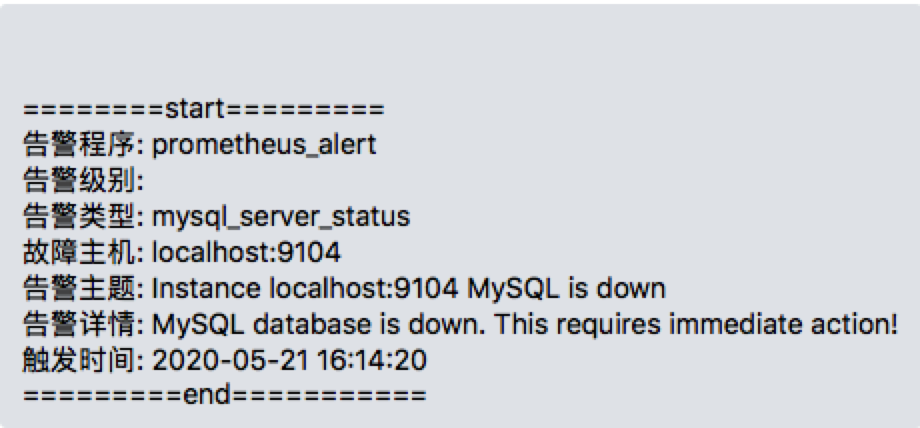
函数介绍
rate() rate(v range-vector) 函数可以直接计算区间向量 v 在时间窗口内平均增长速率

若有收获,就点个赞吧
0 人点赞
