1. 服务器规划
| 序号 | 主机名 | 主机IP | 角色 |
|---|---|---|---|
| 1 | prometheus.itcast.cn | 192.168.10.100 | prometheus |
| 2 | agent.itcast.cn | 192.168.10.111 | agent |
| 3 | grafana.itcast.cn | 192.168.10.112 | grafana |
2. 初始化服务器
- 配置IP地址
- 设置Hostname主机名
- 绑定/etc/hosts文件
- 同步时间(非常重要)
Hostname设置:
[root@localhost ~]# hostnamectl set-hostname prometheus.itcast.cn
[root@localhost ~]# hostnamectl set-hostname agent.itcast.cn
[root@localhost ~]# hostnamectl set-hostname grafana.itcast.cn
绑定/etc/hosts文件
[root@prometheus ~]# vim /etc/hosts
192.168.10.110 prometheus.itcast.cn192.168.10.111 agent.itcast.cn192.168.10.112 grafana.itcast.cn
同步时间
[root@prometheus ~]# yum -y install ntpdate (三个服务器上都要执行)
[root@prometheus ~]# ntpdate cn.ntp.org.cn (三个服务器上都要执行)
3. 安装 Prometheus
1)下载软件包并上传
下载地址:https://prometheus.io/download/
2)解压软件包
[root@prometheus software]# tar -zxvf prometheus-2.29.1.linux-amd64.tar.gz -C /usr/local
[root@prometheus software]# cd /usr/local/
3)修改名称
[root@prometheus local]# mv prometheus-2.29.1.linux-amd64 prometheus
4)使用默认配置启动prometheus
[root@prometheus local]# cd prometheus/
[root@prometheus prometheus]# ./prometheus —version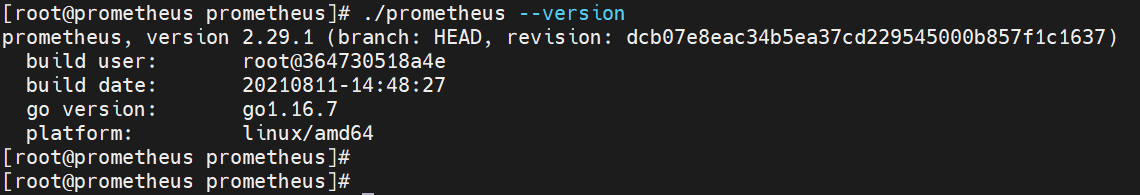
5)添加到系统服务
[root@prometheus prometheus]# mkdir -p /usr/local/prometheus/data
[root@Prometheus prometheus]# vim /usr/lib/systemd/system/prometheus.service
[Unit]Description=Prometheus Monitoring SystemDocumentation=Prometheus Monitoring SystemAfter=network.target[Service]Restart=on-failureType=simpleExecStart=/usr/local/prometheus/prometheus --storage.tsdb.path=/usr/local/prometheus/data --config.file=/usr/local/prometheus/prometheus.yml[Install]WantedBy=multi-user.target
5)启动并设置开机自启
[root@prometheus prometheus]# systemctl enable —now prometheus
[root@prometheus prometheus]# systemctl status prometheus
或,后台启动
[root@prometheus prometheus]# ./prometheus —config.file=”/usr/local/prometheus/prometheus.yml” &
./prometheus --config.file="/usr/local/prometheus/prometheus.yml" &
[root@prometheus prometheus]# netstat -anlp | grep 9090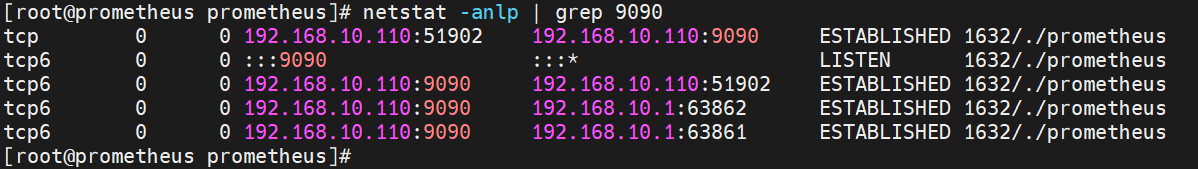
6)浏览器访问Prometheus
http://192.168.10.110:9090/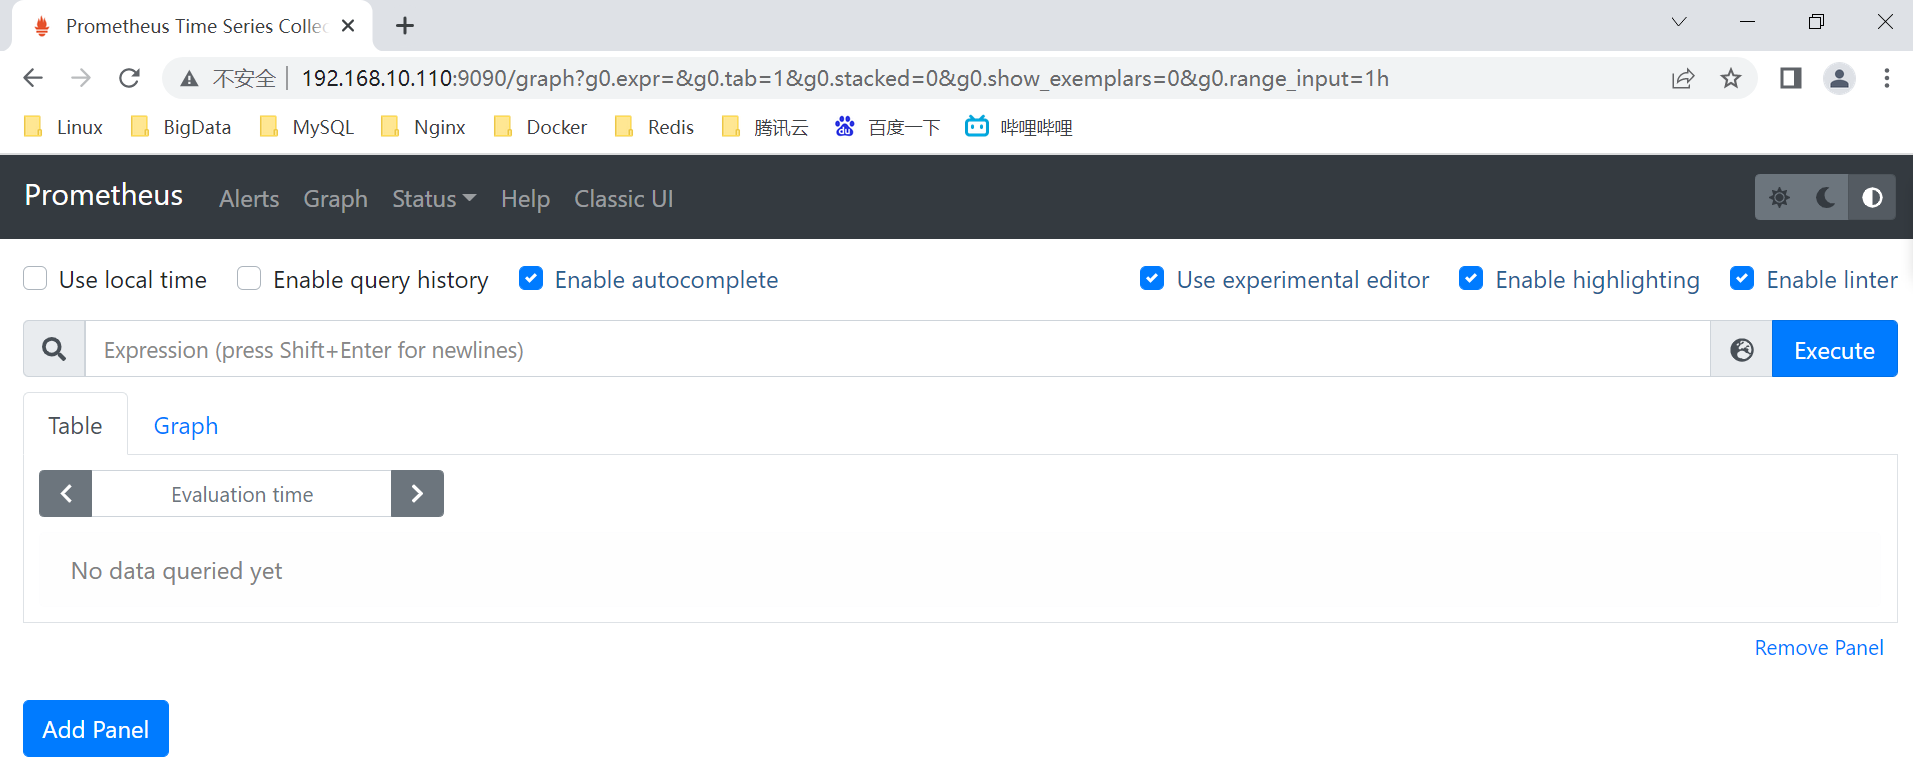
4. 监控远程Linux主机
在被监控主机上(agent)安装node_exporter组件
下载地址:https://prometheus.io/download/#node_exporter
把node_exporter软件包山传至被监控主机
[root@grafana software]# tar -zxvf node_exporter-1.2.2.linux-amd64.tar.gz -C /usr/local
[root@grafana software]# cd /usr/local/
[root@grafana local]# mv node_exporter-1.2.2.linux-amd64 node_exporte
[root@grafana local]# vim /usr/lib/systemd/system/node_exporter.service
[Unit]Description=Prometheus node_exporter[Service]User=nobodyExecStart=/usr/local/node_exporter/node_exporter --log.level=errorExecStop=/usr/bin/killall node_exporter[Install]WantedBy=default.target
[root@grafana local]# systemctl enable —now node_exporter
[root@grafana local]# nohup /usr/local/node_exporte/node_exporter & (& 后台启动)
[root@grafana local]# netstat -anlp | grep 9100
浏览器访问验证:
http://192.168.10.111:9100/metrics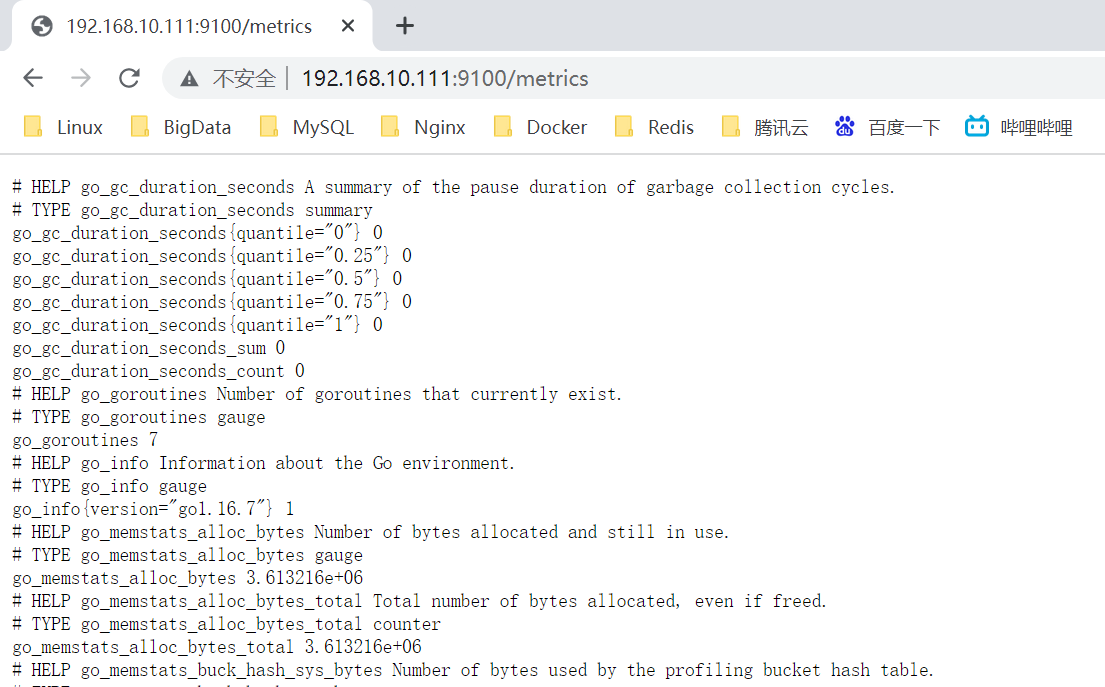
prometheus服务的配置文件中添加被监控主机
[root@prometheus ~]# cd /usr/local/prometheus/
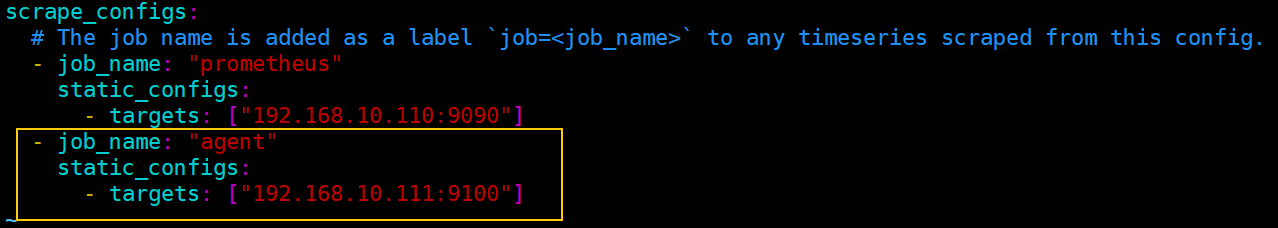
[root@prometheus prometheus]# vim prometheus.yml 末尾添加如下内容(注意对齐)
......scrape_configs:......- job_name: "agent"static_configs:- targets: ["192.168.10.111:9100"]
重启prometheus服务
[root@prometheus prometheus]# pkill prometheus (关闭)
[root@prometheus prometheus]# lsof -i:9090 (确认是否正常关闭)
[root@prometheus prometheus]# ./prometheus & (后台启动)
[root@prometheus prometheus]# lsof -i:9090 (确认启动是否成功)
prometheus的web界面:Status => Targets 查看被监控主机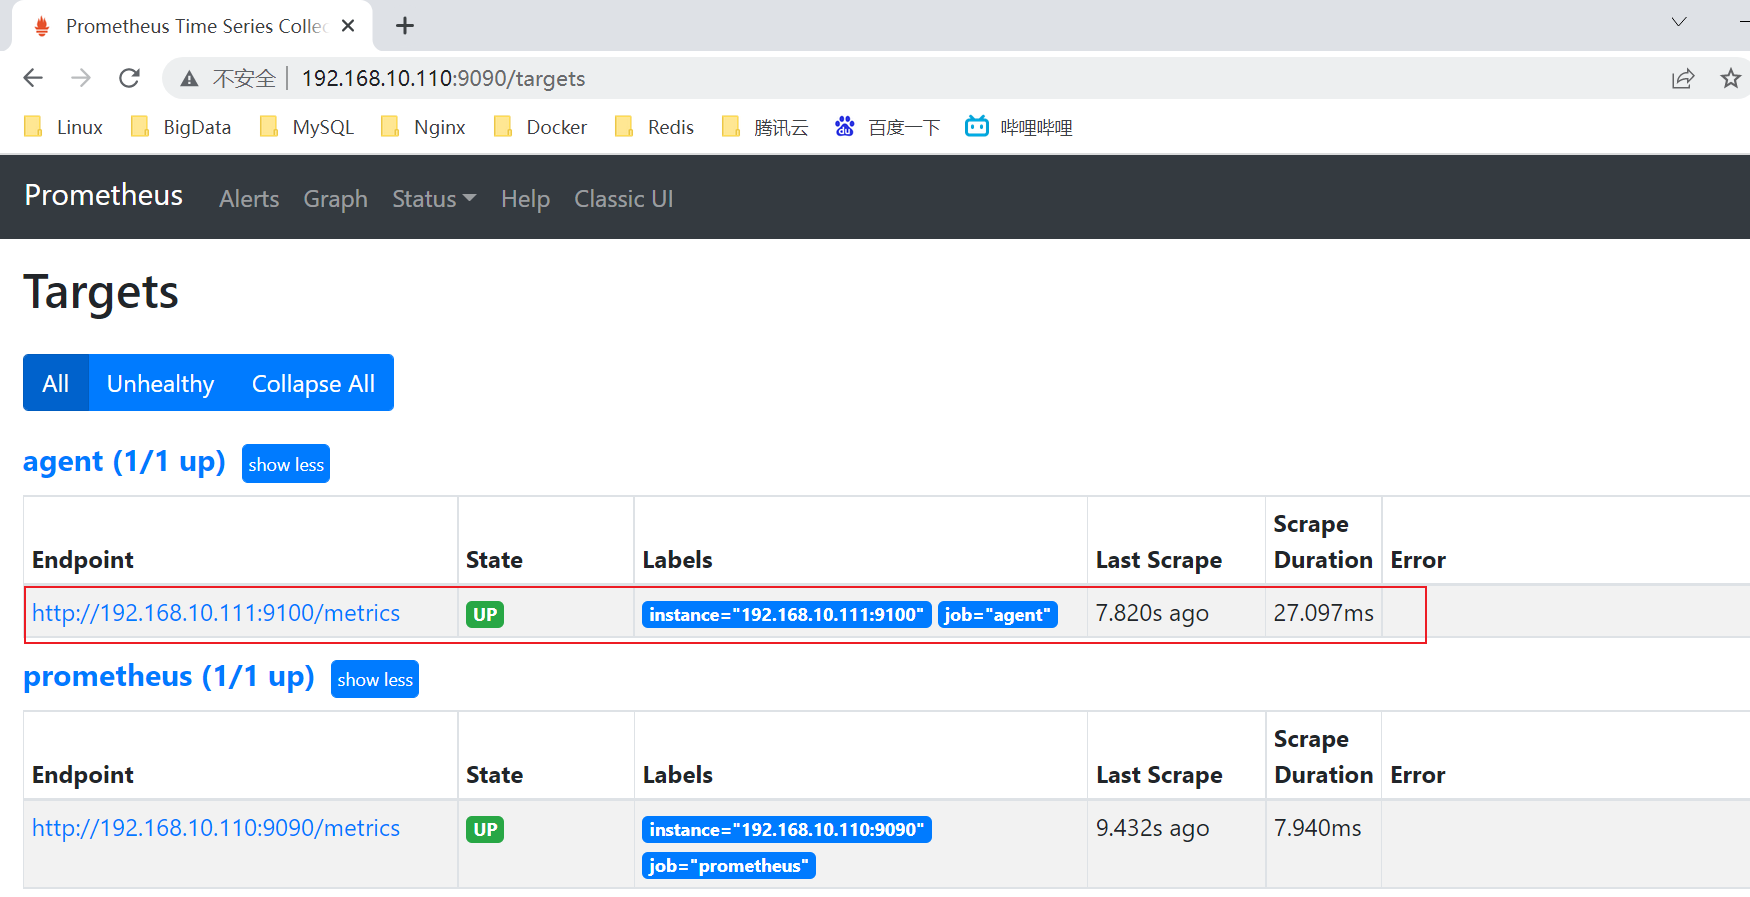
5. 监控远程MySQL
1)被管理主机上安装mysql_exporter组件
将mysqld_exporter-0.11.0.linux-amd64.tar.gz安装上传至被管理主机上
[root@grafana software]# tar -zxvf mysqld_exporter-0.11.0.linux-amd64.tar.gz -C /usr/local/
[root@grafana software]# cd /usr/local/
[root@grafana local]# mv mysqld_exporter-0.11.0.linux-amd64 mysqld_exporter
2)安装测试数据库mariadb:
[root@agent ~]# yum -y install mariadb mariadb-server
[root@agent ~]# systemctl start mariadb
[root@agent ~]# systemctl status mariadb
[root@agent ~]# systemctl enable mariadb
3)创建mysql账号用于收集数据
[root@agent ~]# mysql -u root -p
MariaDB [(none)]> grant select,replication client,process ON . to ‘mysql_monitor’@’localhost’ identified by ‘123456’;
注意:授权ip 为localhost,因为不是prometheus 服务器来直接找mariadb 获取数据,而是prometheus 服务器找mysql_exporter,mysql_exporter再找mariadb。所以这个localhost是指的mysql_exporter的IP
MariaDB [(none)]> flush privileges;
MariaDB [(none)]> quit
4) 在mysql_exporter组中配置mysql信息
创建mariadb配置文件 .my.cnf
[root@agent ~]# mkdir /usr/local/mysqld_exporter
[root@agent ~]# vim /usr/local/mysqld_exporter/.my.cnf
[client]user=mysql_monitorpassword=123456
5) 启动mysqld_exporter
[root@agent ~]# nohup /usr/local/mysqld_exporter/mysqld_exporter —config.my-cnf=/usr/local/mysqld_exporter/.my.cnf &
nohup /usr/local/mysqld_exporter/mysqld_exporter --config.my-cnf=/usr/local/mysqld_exporter/.my.cnf &
[root@agent ~]# lsof -i:9104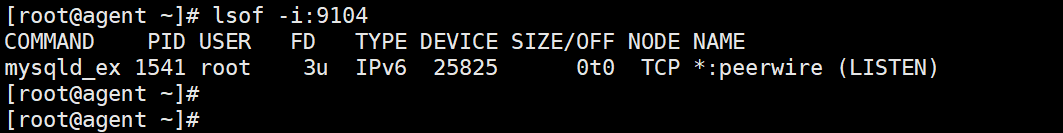
6)prometheus服务的配置文件中添加mariadb配置字段
scrape_configs:......- job_name: "agent_mariadb"static_configs:- targets: ["192.168.10.111:9104"]
7)重启prometheus 服务
[root@prometheus prometheus]# pkill prometheus
[root@prometheus prometheus]# lsof -i:9090
[root@prometheus prometheus]# /usr/local/prometheus/prometheus &
[root@prometheus prometheus]# lsof -i:9090
8)prometheus的web界面:Status => Targets 查看被监控mariadb信息
http://192.168.10.110:9090/targets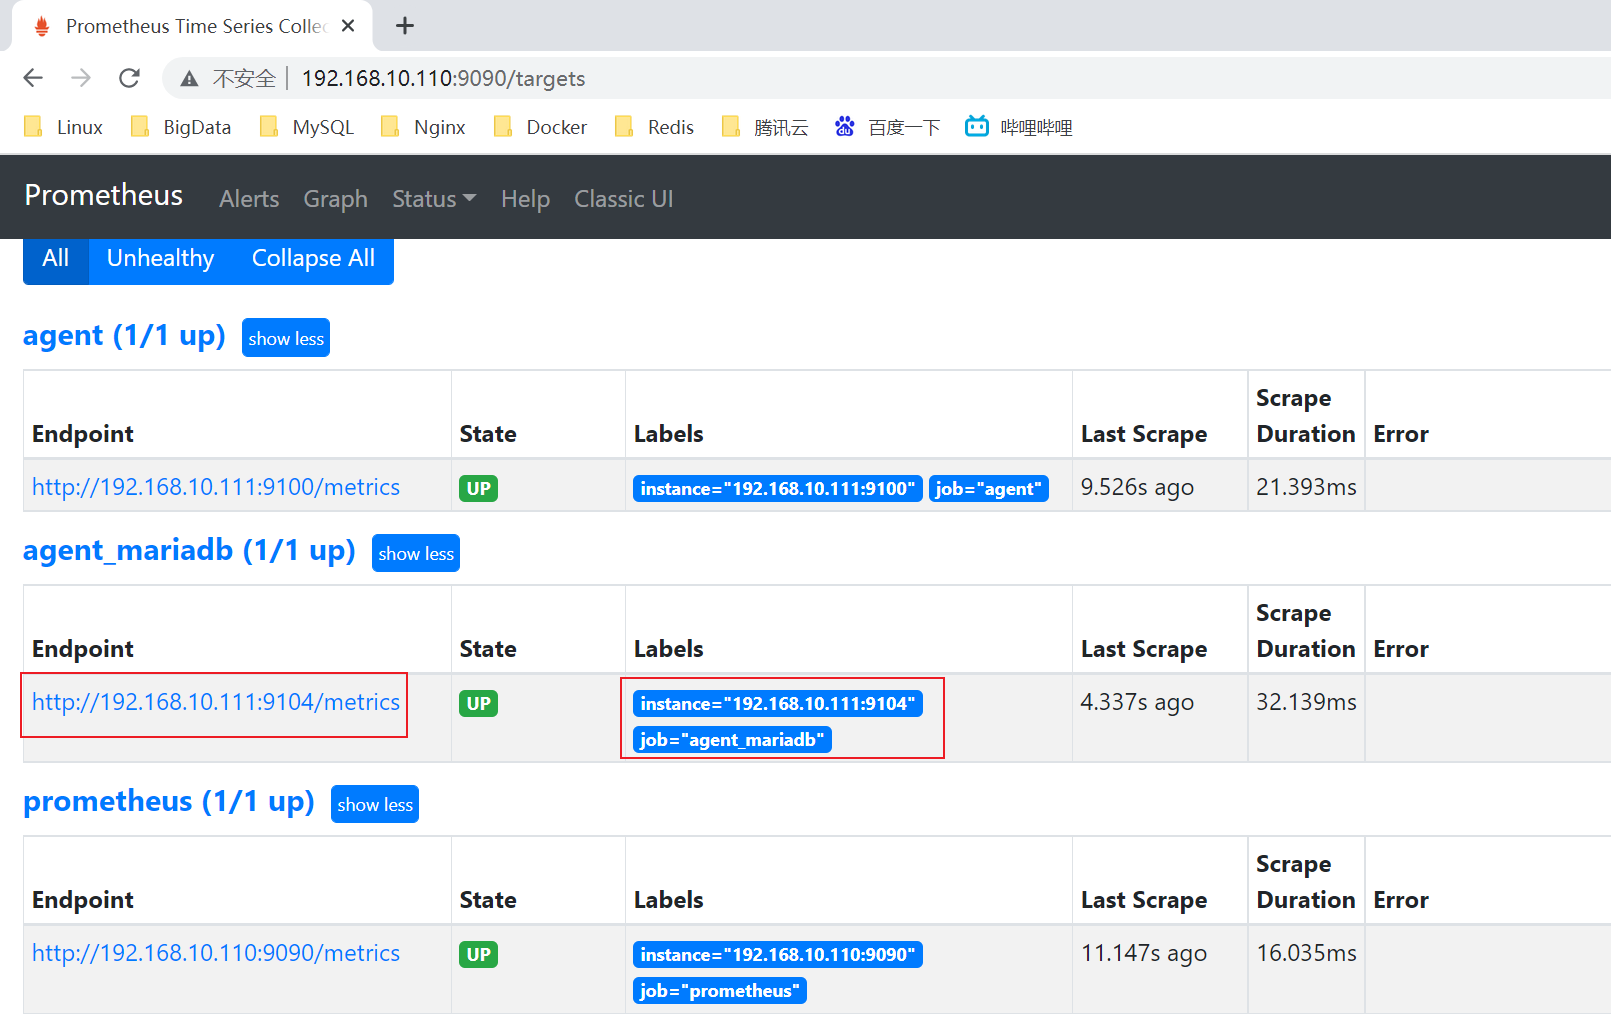

若有收获,就点个赞吧
0 人点赞
