控制机:本机Mac, 安装启动 prometheus, 启动后默认暴露9090端口
监测机:远程云主机,安装启动 node_exporter,启动后默认暴露9100端口
prometheus 就是通过 IP:9100/metrics 抓取数据
控制机
下载
解压
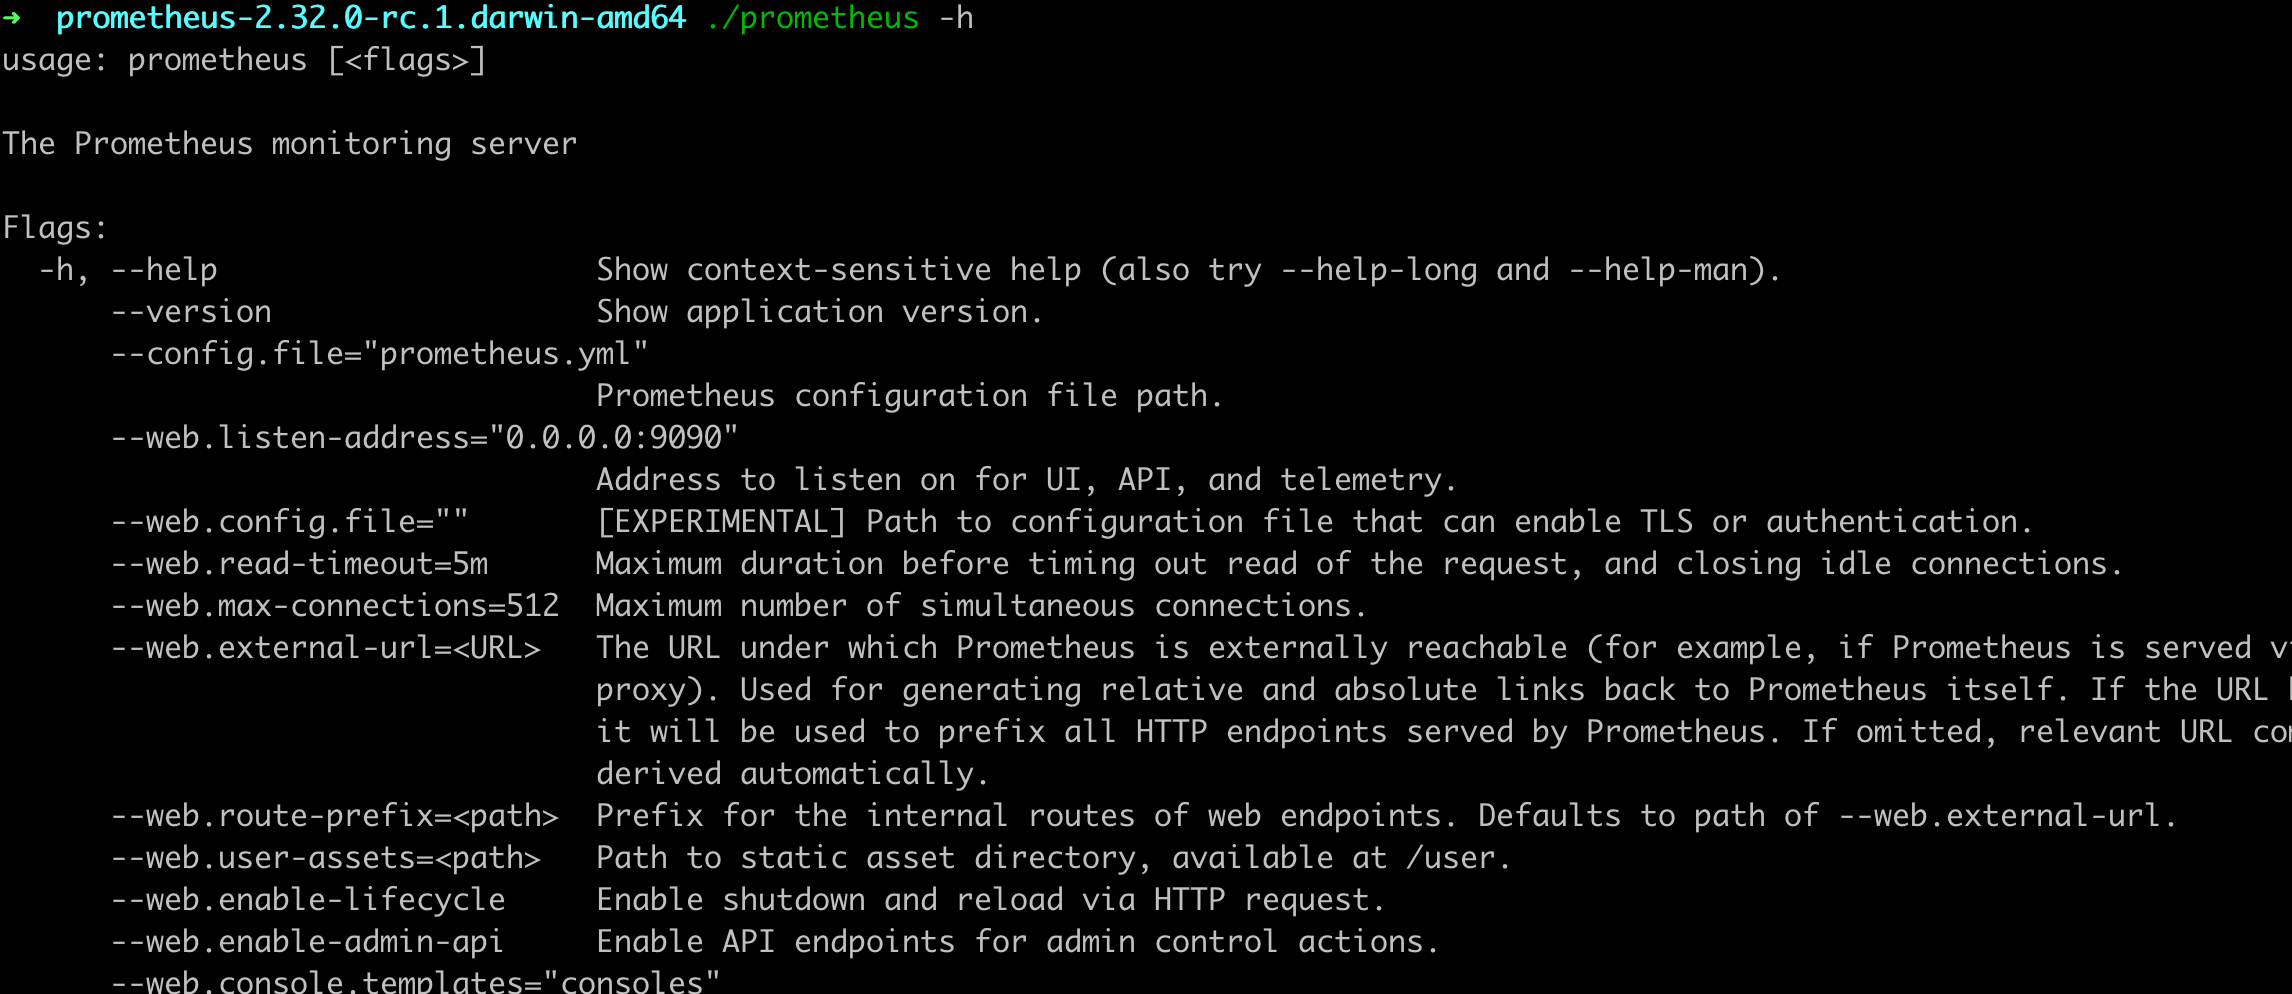
有两个bin文件
| prometheus | Prometheus监听服务器,去指定的节点抓数据 |
|---|---|
| promtool | 验证配置文件 |
mv prometheus /usr/local/bin
mv promtool /usr/local/bin
如果是Linux系统,可以做成系统服务
vim /etc/systemd/system/prometheus.service
[Unit]Description=PrometheusDocumentation=https://prometheus.io/After=network.target[Service]Type=simpleExecStart=/usr/local/bin/prometheus --web.enable-lifecycle --config.file=/opt/prometheus/prometheus.yml --storage.tsdb.retention.time=7d --storage.tsdb.path=/opt/prometheus/dataRestart=on-failure[Install]WantedBy=multi-user.target
设置开机自启,并检查服务开启状态
sudo systemctl enable prometheus
sudo systemctl start prometheus
sudo systemctl status prometheus
prometheus 启动命令
prometheus --config.file="main.yaml" --storage.tsdb.retention.time=7d --web.enable-admin-api --web.enable-lifecycle
�这个是主配置文件,可以配置抓取目标,抓取频率,告警目标等
main.yaml
# my global configglobal:scrape_interval: 15s # Set the scrape interval to every 15 seconds. Default is every 1 minute.evaluation_interval: 15s # Evaluate rules every 15 seconds. The default is every 1 minute.# scrape_timeout is set to the global default (10s).# Alertmanager configuration# 先注释,等启动Alertmanager再开启# alerting:# alertmanagers:# - static_configs:# - targets:# - localhost:9093# Load rules once and periodically evaluate them according to the global 'evaluation_interval'.# 告警规则# rule_files:# - rules/*.yml# - "alert_rule1.yaml"# A scrape configuration containing exactly one endpoint to scrape:# 这里表示抓取对象的配置# Here it's Prometheus itself.# 这里是抓取promethues自身的配置scrape_configs:# The job name is added as a label `job=<job_name>` to any timeseries scraped from this config.# 这个配置是表示在这个配置内的时间序例,每一条都会自动添加上这个{job_name:"prometheus"}的标签。- job_name: "prometheus"# 默认通过 localhost:9090/metrics 该地址抓起指标信息# metrics_path defaults to '/metrics'# scheme defaults to 'http'.# 重写了全局抓取间隔时间,由15秒重写成5秒。scrape_interval: 5sstatic_configs:- targets: ["localhost:9090"]- job_name: "cloud2"scrape_interval: 15sstatic_configs:- targets: ["49.xxx.xxx.70:9100"]basic_auth:username: prometheuspassword: XlP*****BjAen
部署node_exporter到监测节点
主要用来监控服务器的基础信息,如: cpu、内存、磁盘、网卡
下载 node_exporter-1.3.1.linux-amd64.tar
wget https://finley-soft.pek3b.qingstor.com/node_exporter
mv node_exporter /usr/local/bin
如果不希望任何人都能访问web页面,创建web配置文件,使用basic auth
vi /opt/node_exporter/web-config.yaml
basic_auth_users:prometheus: $2y$10$Os6Pjwg********Xu2zagy96E.dFqhZywaUphuNSEjzfN742
vi /etc/systemd/system/node_exporter.service
[Unit]Description=node_exporterDocumentation=https://prometheus.io/After=network.target[Service]Type=simpleUser=ubuntuExecStart=/usr/local/bin/node_exporter --web.listen-address=":9100" --web.config="/opt/node_exporter/web-config.yaml"Restart=on-failure[Install]WantedBy=multi-user.target
systemctl enable node_exporter
systemctl start node_exporter
浏览器打开 localhost:9100
如果node_exoporter跑在服务器,注意防火墙开放相关端口

若有收获,就点个赞吧
0 人点赞
