echarts,react hooks 组件化封装
Echart.jsx
import React, {useCallback, useEffect, useRef} from 'react';import {object, number, array, oneOf, bool} from 'prop-types';import debounce from 'lodash.debounce';// 引入核心模块 echarts必须要的接口import * as echarts from 'echarts/core';// 必须引入渲染器 CanvasRenderer & SVGRendererimport {CanvasRenderer, SVGRenderer} from 'echarts/renderers';// const dpr = window.devicePixelRatio; // 设备分辨率const RenderEngine = {canvas: CanvasRenderer,svg: SVGRenderer}Echarts.propTypes = {options: object.isRequired,height: number,renderType: oneOf(['canvas', 'svg']),components: array,style: object,loading: bool,};Echarts.defaultProps = {height: 320,renderType: 'canvas',components: [],style: {},loading: false,};function Echarts(props) {const {renderType, options, style, height, components, loading} = props;const chartRef = useRef(null); // DOM节点const chartInstance = useRef(null); // Echart实例const isEmpty = !Object.keys(options).length; // options是否为空const handleResize = debounce(() => {const {current} = chartInstance;if (!current) return;current.resize({animation: {duration: 500}});}, 300);// 初始化图表配置项const renderChart = useCallback(() => {if(isEmpty) returnconst {current} = chartRef;if (!current) {return console.error('init echarts DOM error');}// 单例模式,获取 dom容器上的实例const render = echarts.getInstanceByDom(current);chartInstance.current = render ?? echarts.init(current, null, {renderer: renderType,});showLoading(chartInstance.current)chartInstance.current.setOption(options);}, [options, renderType, loading]);useEffect(init, []);// 注册必须的组件function init() {const MapRender = RenderEngine[renderType] || CanvasRenderer;// 必须在echarts.init之前使用echarts.use([MapRender, ...components]);// 监听 resize屏幕变化window.addEventListener('resize', handleResize);return () => {window.removeEventListener('resize', handleResize);};}useEffect(() => {renderChart();return () => {const {current} = chartInstance;if (!current) return;current.dispose();}}, [chartInstance, renderChart]);function showLoading(chartInstance) {if(!loading) {return chartInstance.hideLoading()}chartInstance.showLoading("default", {text: "加载中...",color: "rgb(244, 148, 148)",textColor: "rgb(112,112, 121)",maskColor: "rgba(255, 255, 255, 0.8)",zlevel: 0,showSpinner: true,});}if(!Object.keys(options).length) {return null}const attrs = {ref: chartRef,style: {height,...style,}}return (<div {...attrs}/>);}export default Echarts;
LineChart
LineCart.jsx
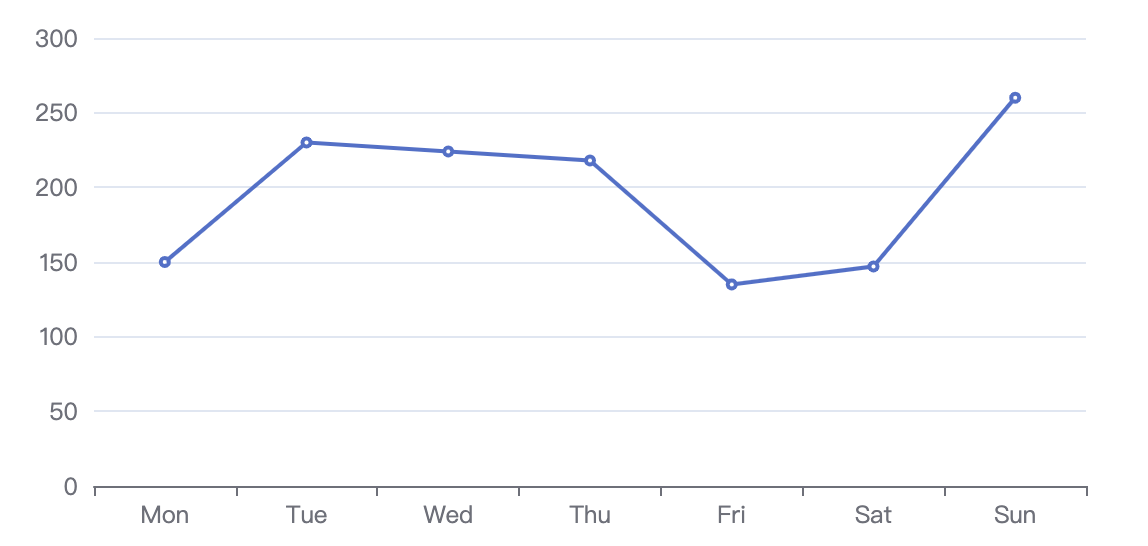
import React, {useEffect, useState} from 'react';import { array, bool } from 'prop-types';import { GridComponent } from 'echarts/components';import { LineChart } from 'echarts/charts';import { UniversalTransition } from 'echarts/features';import Echarts from '../Echarts'const OPTIONS = {xAxis: {type: 'category',boundaryGap: false,data: ['Mon', 'Tue', 'Wed', 'Thu', 'Fri', 'Sat', 'Sun']},yAxis: {type: 'value',splitLine: { // 改为虚线网格show: true,lineStyle:{type:'dashed'}}},series: [{data: [150, 230, 224, 218, 135, 147, 260],type: 'line',smooth: true,}],grid: {left: 32,top: 16,right: 16,bottom: 32,containLabel: false // 防止标签溢出}};Chart.propTypes = {loading: bool,};Chart.defaultProps = {loading: false,};function Chart({loading}) {const [options, setOptions] = useState({});useEffect(update, [loading]);function update() {setOptions(OPTIONS)}return (<Echarts// renderType='svg'options={options}components={[GridComponent, LineChart, UniversalTransition]}/>);}export default Chart;
usage
<LineChart />

若有收获,就点个赞吧
0 人点赞
