一、环境准备
1.准备Flask开发环境
安装包
flaskflask-sqlalchemyflask-mysqldb
创建flask实例
app = Flask(__name__)
创建蓝图
# -*- coding:utf-8 -*-# Created by ZhaoWen on 2020/10/11from flask import Blueprintmatplot_print = Blueprint('matplot_print',__name__)@matplot_print.route('/mat')def index():return 'Hello Matplotlib !'
注册蓝图
app.register_blueprint(matplot_print,prefix='')
此时我们在控制台查看url映射,就可以看到matplot_print视图已经成功注册到flask主程序中去了
<Rule '/mat' (OPTIONS, HEAD, GET) -> matplot_print.index>,
此时启动flask应用,访问指定路径已经可以成功访问了
2.准备matplotlib开发环境
pipenv install matplotlib
安装时间比较长,耐心等候
二、数据准备
我们直接使用数据库中的数据
1.ORM映射实体类
class Tbl_Video_Game_Sales(db.Model):__tablename__ = 't_video_game_sales'Rank = db.Column(db.String(255),primary_key=True) #销售排名Name = db.Column(db.String(255)) #游戏名称Platform = db.Column(db.String(255)) #该游戏发布平台Year = db.Column(db.Integer) #发布年份(1980-2016)Genre = db.Column(db.String(255)) #游戏类型Publisher = db.Column(db.String(255)) #出版公司NA_Sales = db.Column(db.DECIMAL(255,2)) #北美区域销量(以百万为单位计数)EU_Sales = db.Column(db.DECIMAL(255,2)) #欧美区域销量(以百位为单位计数)JP_Sales = db.Column(db.DECIMAL(255,2)) #日本区域销量(以百位为单位计数)Other_Sales = db.Column(db.DECIMAL(255,2)) #其他国家销量(以百位为单位计数)Global_Sales = db.Column(db.DECIMAL(255,2)) #全球销量(以百位为单位计数)
2.进行简单查询
Tbl_Video_Game_Sales.query.all()[:10]
执行上面那条语句,我们从数据库中获得了十个对象
<Tbl_Video_Game_Sales 1><Tbl_Video_Game_Sales 2><Tbl_Video_Game_Sales 3><Tbl_Video_Game_Sales 4><Tbl_Video_Game_Sales 5><Tbl_Video_Game_Sales 6><Tbl_Video_Game_Sales 7><Tbl_Video_Game_Sales 8><Tbl_Video_Game_Sales 9><Tbl_Video_Game_Sales 10>
执行一个简单的循环遍历,获取到每个对象的名字
Wii SportsSuper Mario Bros.Mario Kart WiiWii Sports ResortPokemon Red/Pokemon BlueTetrisNew Super Mario Bros.Wii PlayNew Super Mario Bros. WiiDuck Hunt
三、图形实战
2000~2010(不含)之间全球游戏销量最高的前十位
Tbl_Video_Game_Sales.query.filter(Tbl_Video_Game_Sales.Year>2000).filter(Tbl_Video_Game_Sales.Year<2005).order_by(Tbl_Video_Game_Sales.Global_Sales.desc())[:10]
1.柱状图(bar)
2000~2010(不含)之间全球游戏销量最高的前十位
Tbl_Video_Game_Sales.query.filter(Tbl_Video_Game_Sales.Year>2000).filter(Tbl_Video_Game_Sales.Year<2005).order_by(Tbl_Video_Game_Sales.Global_Sales.desc())[:10]
@matplot_print.route('/mat/bar-show')def bar_show():data = Tbl_Video_Game_Sales.query.filter(Tbl_Video_Game_Sales.Year>2000).filter(Tbl_Video_Game_Sales.Year<2005).order_by(Tbl_Video_Game_Sales.Global_Sales.desc())[:10]path = 'mat_bar.jpg'if os.path.exists(root+path) is False:get_bar(data,path)return render_template('/matplotlib/bar-chart.html',path=path)def get_bar(data,path):'''柱状图:param data::return:'''bar_x = list()bar_y = list()for d in data:bar_x.append(d.Name)bar_y.append(d.Global_Sales)for x,y in zip(bar_x,bar_y):plt.text(x+3, y + 1, '%.2f' % y, ha='center', va='bottom')plt.bar(bar_x,bar_y) # 直角坐标轴 设置颜色plt.savefig('.'+root+path)
最终效果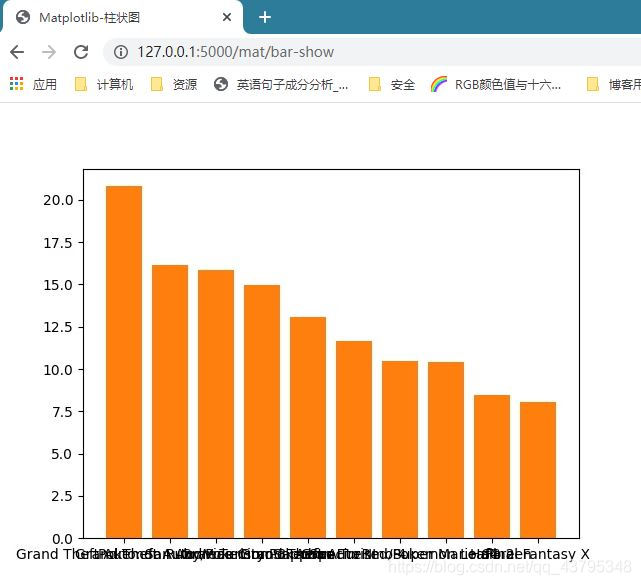 这里因为数据格式问题,x轴的字体挤在一起了,之后进行调整
2.折线图
def get_line(data,path):'''折线图:param data::param path::return:'''x = [d.Name for d in data] # 横坐标轴y = [float(d.Global_Sales) for d in data] # 纵坐标轴plt.plot(x,y)plt.savefig('.'+root+path)
3.饼图
def get_pie(data,path):'''饼图:param data::param path::return:'''sizes = [d.Global_Sales for d in data]labels = [d.Name for d in data]plt.pie(x=sizes,shadow=True,labels=labels)plt.title('2000年~2010年游戏全球销量前十')# plt.legend(labels) # 图例plt.savefig('.'+root+path)
效果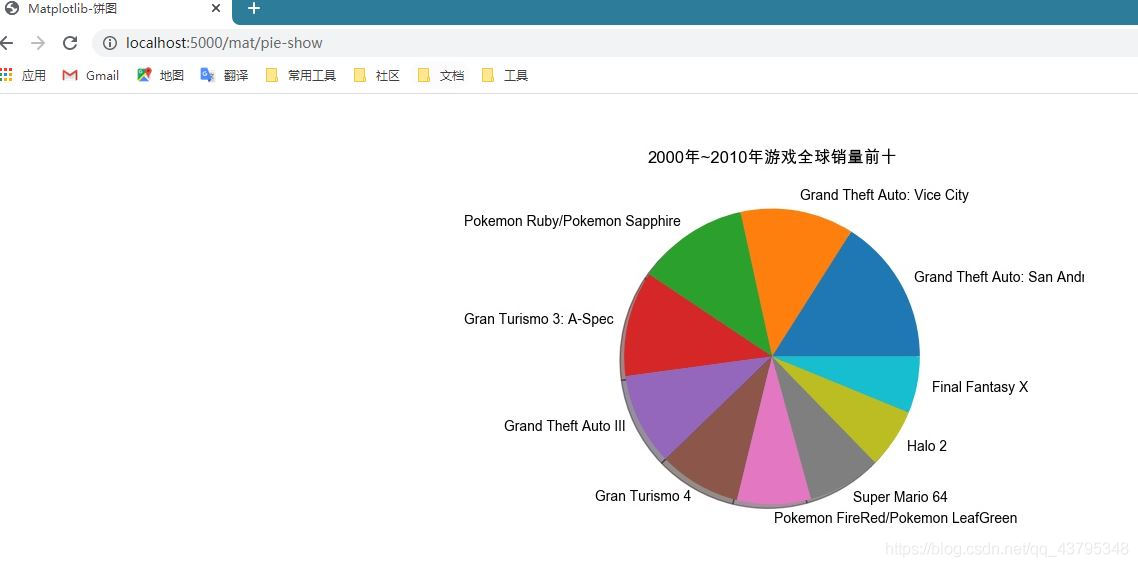
四、参考资料/扩展阅读
《Python数据可视化编程实战》:https://book.douban.com/subject/26378430/
《matplotlib官方文档》:https://matplotlib.org/users/index.html
Matplotlib教程-莫烦Python:https://www.bilibili.com/video/BV1Jx411L7LU?p=2
数据化雷达图教程:https://www.bilibili.com/video/BV1PQ4y1M7x7?t=4688
五、常见问题
1.图片中文字体乱码或者非正常显示
plt.rcParams['font.sans-serif'] = ['Arial Unicode MS']
2.TypeError: ‘list’ object cannot be interpreted as an integer
出现位置:调用numpy.concatenate()方法时报错问题出现原因:传入参数没有按照concatenate((a1, a2, ...), axis=0, out=None)的格式来,比如我报错的原因就是把theta = np.concatenate((theta, [theta[0]]))错写为theta = np.concatenate(theta, [theta[0]])

若有收获,就点个赞吧
0 人点赞
